
How a Three-Person MPO Is Putting Safety First Across an $11.25M Road Improvement Plan
See how the three-person Santa Fe MPO used Ecopia data to run its own safety-first assessment of an $11.25M road improvement program, replacing a three-year consultant process.
Why safety-first planning depends on asset-level data
Across the United States, metropolitan planning organizations (MPOs) have spent the last several years adopting Vision Zero commitments, complete streets policies, and local road safety plans to eliminate roadway deaths. Since 2022, 200 regional planning agencies have won federal Safe Streets funding, which requires a governing body resolution setting a date for zero fatalities. The plans that money goes toward are built around pedestrians, cyclists, and transit riders, not vehicle throughput alone.

Turning that direction into project decisions is where most agencies stall. A safety-first analysis needs a precise picture of what already exists on the ground: where sidewalks are present and where they end, which crosswalks are marked and which are not, where bicycle lanes exist as paint versus physical separation, and how each intersection is actually configured. Few agencies have that inventory. Building one by hand or by field survey is slow and costly for a small planning staff, and often outdated by the time it is finished, which leaves agencies dependent on external engineering consultants to establish baseline conditions before any safety analysis can begin.
Mapping with artificial intelligence (AI) closes that gap. Ecopia AI (Ecopia) extracts detailed roadway and active transportation features from high-resolution imagery, giving planning agencies a current, consistent, analysis-ready picture of the built environment, and making a safety-first analysis something an agency can run itself.
[slider]
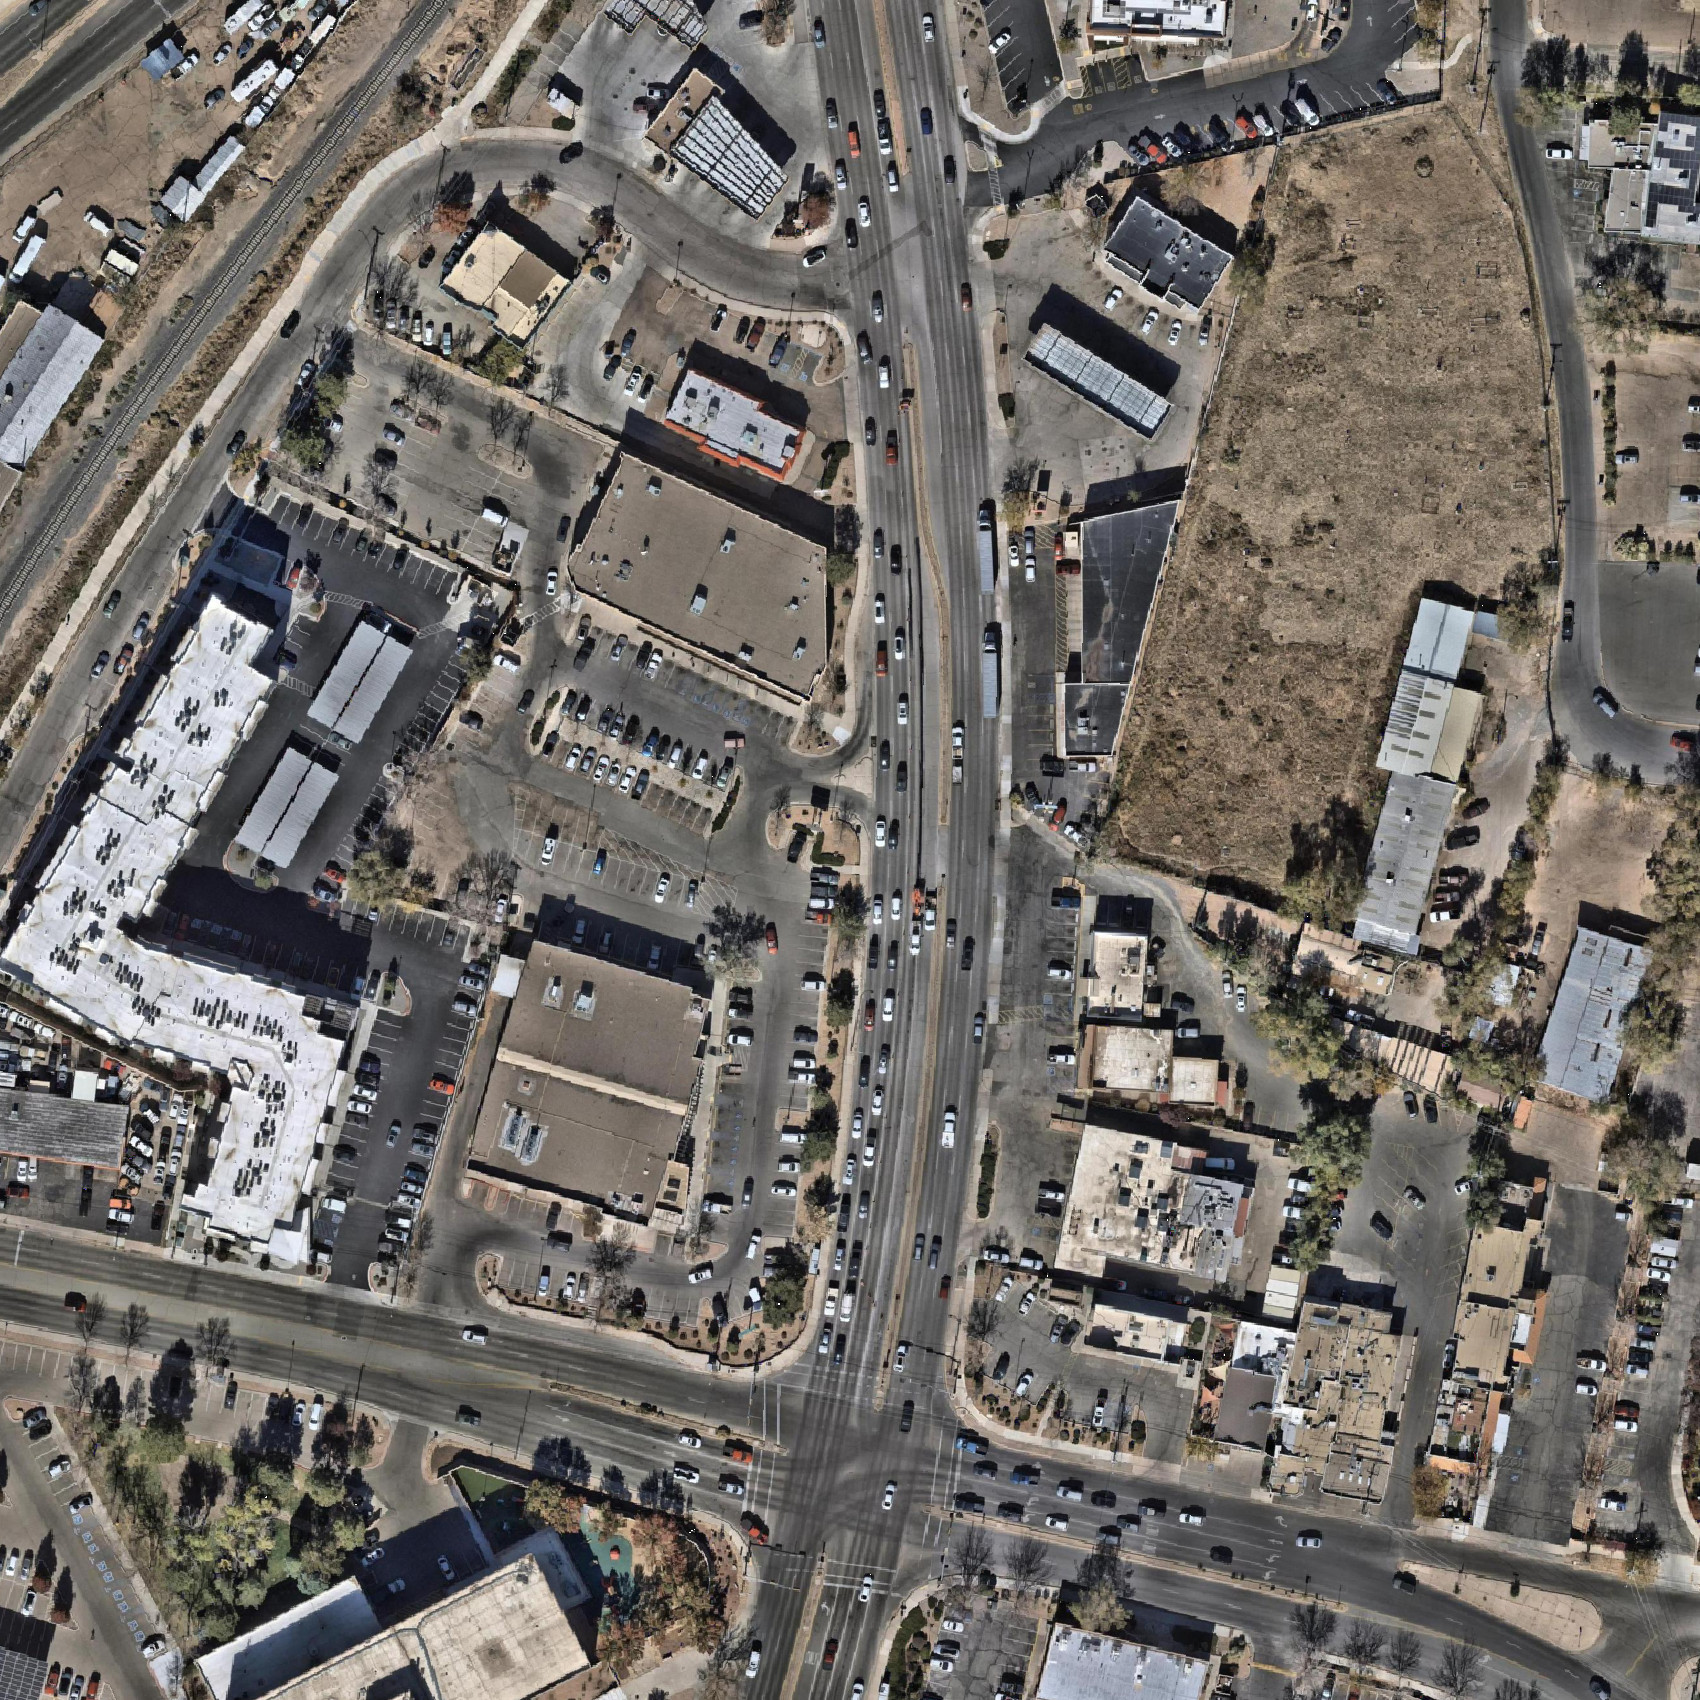

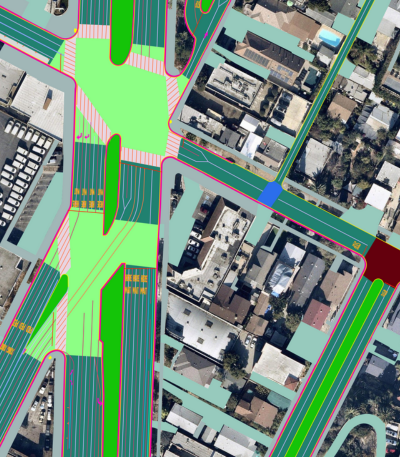
Ecopia’s roadway and transportation features extracted from aerial imagery over Santa Fe, New Mexico.
The challenge: a safety mandate without the baseline data
The Santa Fe MPO coordinates long-range transportation planning across an area serving 116,386 residents, roughly 80% of Santa Fe County’s population, spanning approximately 22% of the county’s land area. It does this with a staff of three.

The agency’s safety mandate is well established. Nationally, 2020 marked an inflection point when traffic volumes fell during the pandemic while fatalities rose, and the pattern showed up in Santa Fe’s own data. In 2022, the City of Santa Fe, Santa Fe County, and the MPO each adopted safety and complete streets resolutions. That same year, the MPO completed its federally funded Local Road Safety Plan, a roughly $250,000 investment that consolidated crash data into an adopted planning document and unlocked further federal safety funding. Through 2023 and 2024, the agency rewrote its traffic impact analysis guidelines around safety outcomes and contributed to a multi-year effort to develop a complete set of safety-focused street design standards for the city.
What the agency did not have was the data to act on any of it. Asset-level inventories of sidewalks, crosswalks, and bicycle lanes did not exist in a current, centralized form, which meant every safety question started from zero. For a three-person staff, each of those questions competed with everything else on the desk. Crash analysis was no easier.
Erick Aune, MPO Director, described the previous workflow: “Safety data would be sent to us in spreadsheets, and we would be charged with taking the time to tease out the elements and factors of crash data to tell a story. That could take weeks of work.”
The result was a familiar bind. As Aune put it, “all of our plans say more safety. We were reliant on engineers and external technicians to do this work at great cost, and it took weeks and months.”
The solution: AI mapping data feeding an AI analysis platform
The MPO began working with Waypoint Transit, an AI analysis platform for infrastructure planning, on crash data analysis, compressing work that had taken weeks into a fraction of the time. From there, the agency expanded into data-driven road safety audits of individual intersections and corridors.
The partnership divides the work three ways. Ecopia supplies the mapped infrastructure, Waypoint provides the environment where those features are combined with other transportation details, and the MPO defines the questions, interprets the findings, and identifies next steps for city planning and design. The value sits in the connection between detailed street features and local decisions.

The constraint on how far that analysis could go was the absence of a digital record of the roadway itself. By August 2026, the MPO had adopted Ecopia’s Advanced Transportation Features data, extracted from June 2024 aerial imagery, which Waypoint ingests alongside crash records, traffic counts, speed data, adopted plans, and design guidance from sources including the Manual on Uniform Traffic Control Devices (MUTCD) and the National Association of City Transportation Officials (NACTO).
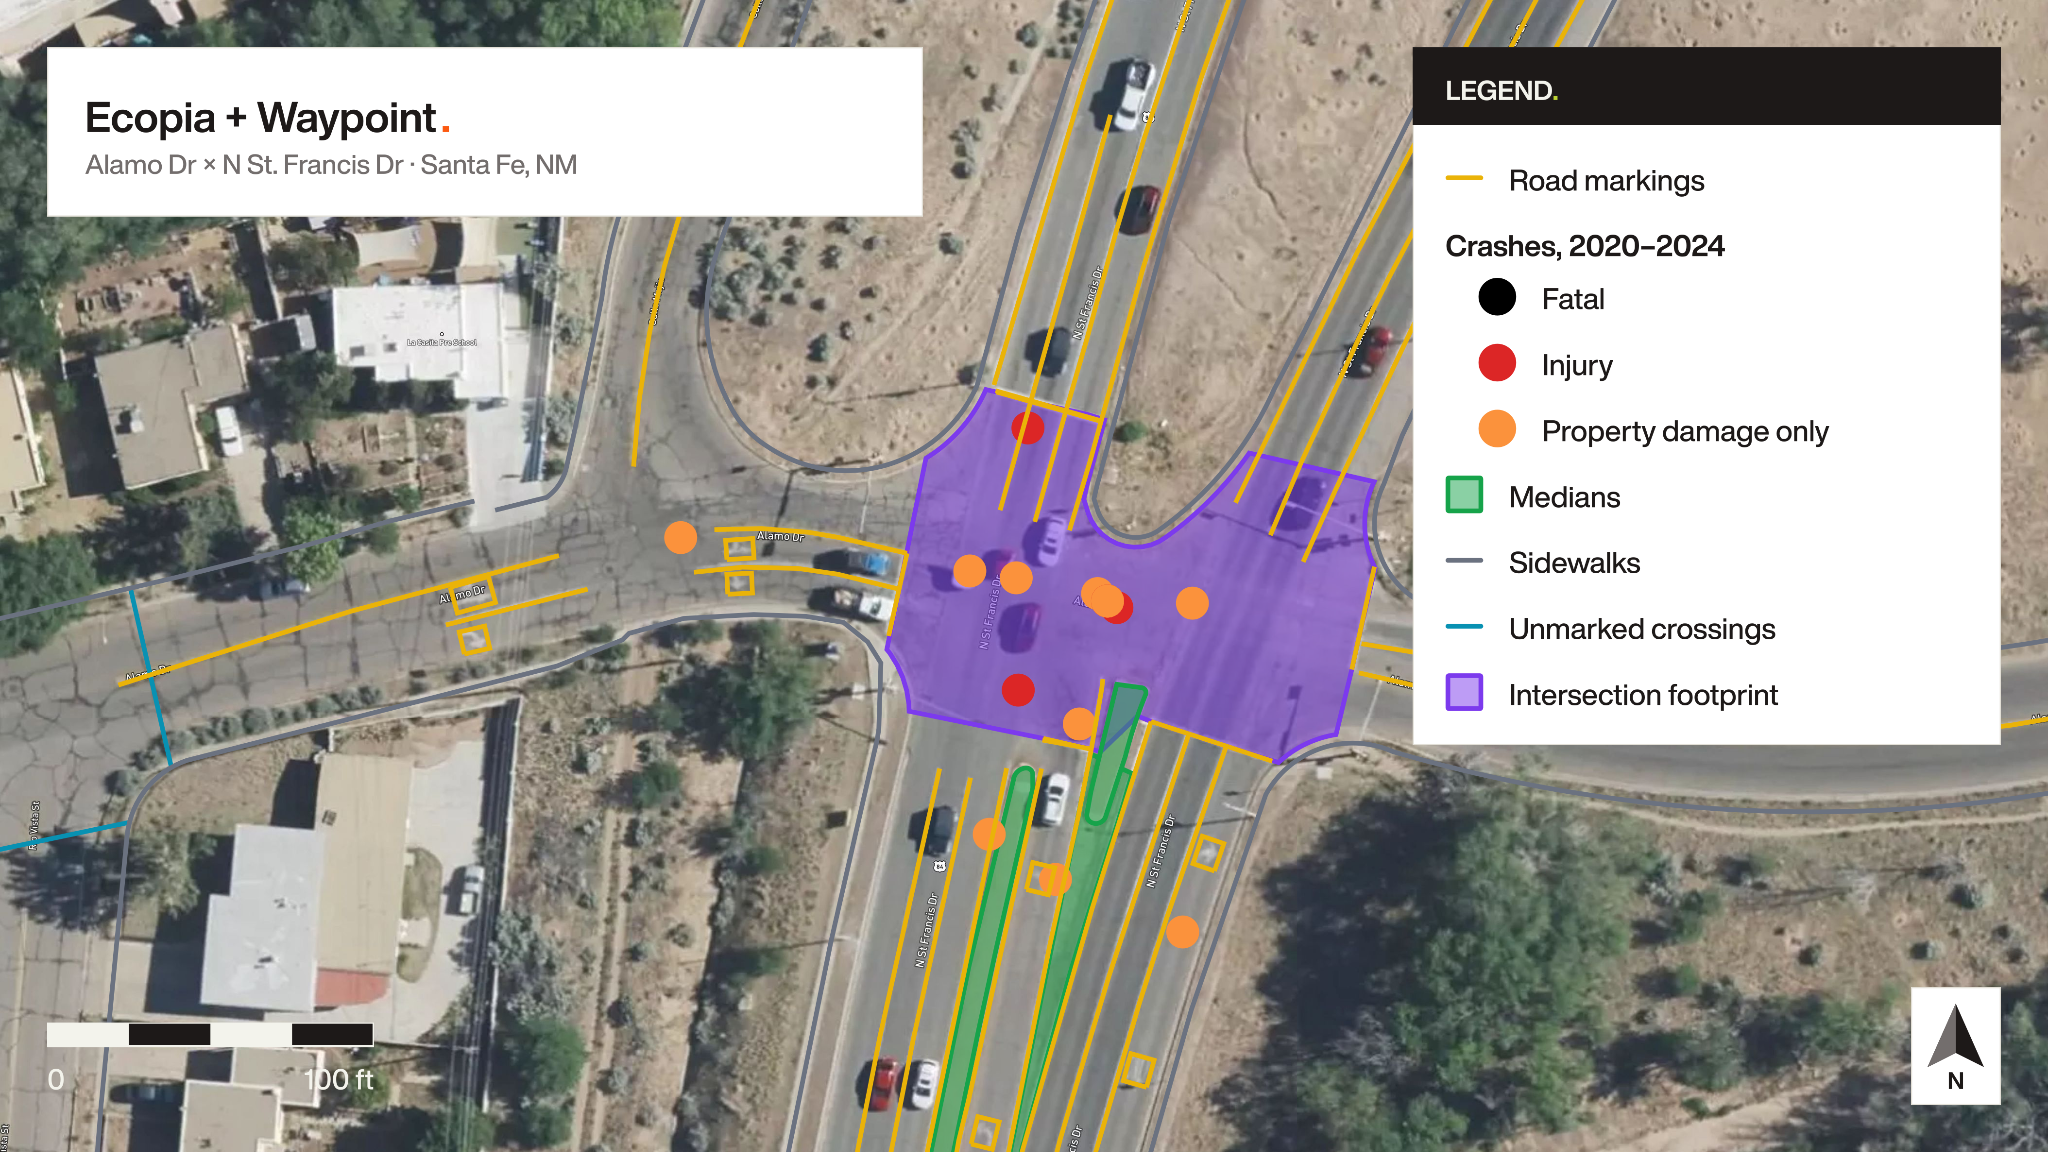
Across the MPO planning area, Ecopia mapped and extracted several types of roadway and active transportation features, including:
- Roadway geometry and lane configuration
- Sidewalks and sidewalk gaps
- Marked and unmarked crosswalks
- Painted bicycle lanes and other bicycle facility types

Ryan Johnston at Waypoint Transit described the role the data plays: “What the Ecopia data really provides is the digitization of the physical assets. A lot of what this comes down to is the fact that these roads were designed poorly, and that led to these outcomes. The Ecopia data gives the AI a way to understand what that design actually is, so it can produce the analysis.”
The difference shows up even at the level of a single feature. Aune had been counting bicycle pavement markings by hand to build an inventory, the kind of task that falls to the director when the staff is three people. “A couple of hours in, I was getting close,” he said. “Then I ran this in about 30 seconds using Ecopia data.”

The workflow keeps professional engineering judgment in the loop. The MPO treats its outputs as pre-engineering analysis, with field verification and licensed traffic engineer review before any funds are committed. “When we go to spend money, there will be a traffic engineer blessing this work,” Aune noted.
The result: a safety-first capital assessment, and three network screens from one delivery
An $11.25M capital program
The clearest demonstration came when Santa Fe’s city council voted for an $11.25 million general obligation bond for roadway and intersection improvements, which will go to voters in November 2026, with the authorizing resolution naming specific corridors and intersections.
Historically, translating that list into a program of work would have meant procuring a traffic engineering consultant to study one corridor at a time, establish existing conditions, and develop cost estimates sequentially, a process Aune estimates would take roughly three years.
Instead, the three-person MPO ran the analysis itself. Working from the resolution, staff report, and supporting documents, the agency had Waypoint map every named location, then layered in the Ecopia feature data, transit routes, demographics, speed and crash data, and current New Mexico unit cost assumptions to produce a corridor-by-corridor assessment.
The defining choice was how the analysis was framed. Rather than optimizing for vehicle operations, the MPO explicitly prioritized safety first, then pedestrian and bicycle access, and then transit access, inverting the conventional order of operations for a program of this kind.
For each named corridor, the output identified:
- Existing sidewalk, crosswalk, and bicycle lane conditions
- The gaps between current conditions and a safety-first design
- Recommended countermeasures
- Cost estimates at current state department of transportation (DOT) rates
- Funding match ratios for additional grant opportunities
Because every recommendation traces back to the MPO’s own adopted plans, each one arrives with its policy justification already attached. The analysis is designed to hand off, not to replace engineering. Delivered corridor by corridor, it gives traffic engineers a documented starting point rather than a blank page, shifting billable engineering hours from establishing baseline conditions to meaningful design work.
For Aune, the shift is about where the analysis places responsibility. “We don’t blame drivers or victims,” he said. “We look at the design and say, what needs to change?” He is equally direct about how Santa Fe’s network reached its current state, calling the collision and fatality rate “difficult to swallow” and “the result of building out a network of roads over the last generation committed to moving cars quickly.”
Three questions, one delivery
Alongside the capital assessment, several network screens completed in August 2026 used Ecopia data as their primary source. Crash history explains where harm has already occurred. An infrastructure inventory lets planners look for recurring design conditions across the whole network. Used together, the two kinds of evidence point staff toward the locations worth investigating further, instead of treating every site as an isolated project.

Right-turn lanes and crossing exposure. Starting from 506 Ecopia right-turn lane centerlines, the MPO screened the 232 lanes longer than 100 feet. A 50-foot spatial buffer identified 107 of those lanes (46%) near marked crosswalks and 67 (29%) near unmarked crossings. The screen produced a network screening matrix and two corridor case studies. Cerrillos Road shows the tension between long turn lanes associated with legacy highway design and a corridor that also serves transit, walking, and biking. On St. Francis Drive, the corridor’s own Road Safety Audit points instead to large corner radii and free-flowing right turns as the related design concerns. Waypoint’s crash records show how common the crash type is citywide: 158 right-turn crashes, 72 of them between a pedestrian and a turning vehicle.

A bicycle network inventory. The same delivery produced a complete picture of the bicycle network: 1,391 centerline segments across 603 road corridors, enough to see where facilities run continuously and where they stop. Individual pavement symbols were not part of this delivery; staff plan to source a symbol inventory separately and check it against the Ecopia bike-lane geometry, which is now the reference for where the network actually is.
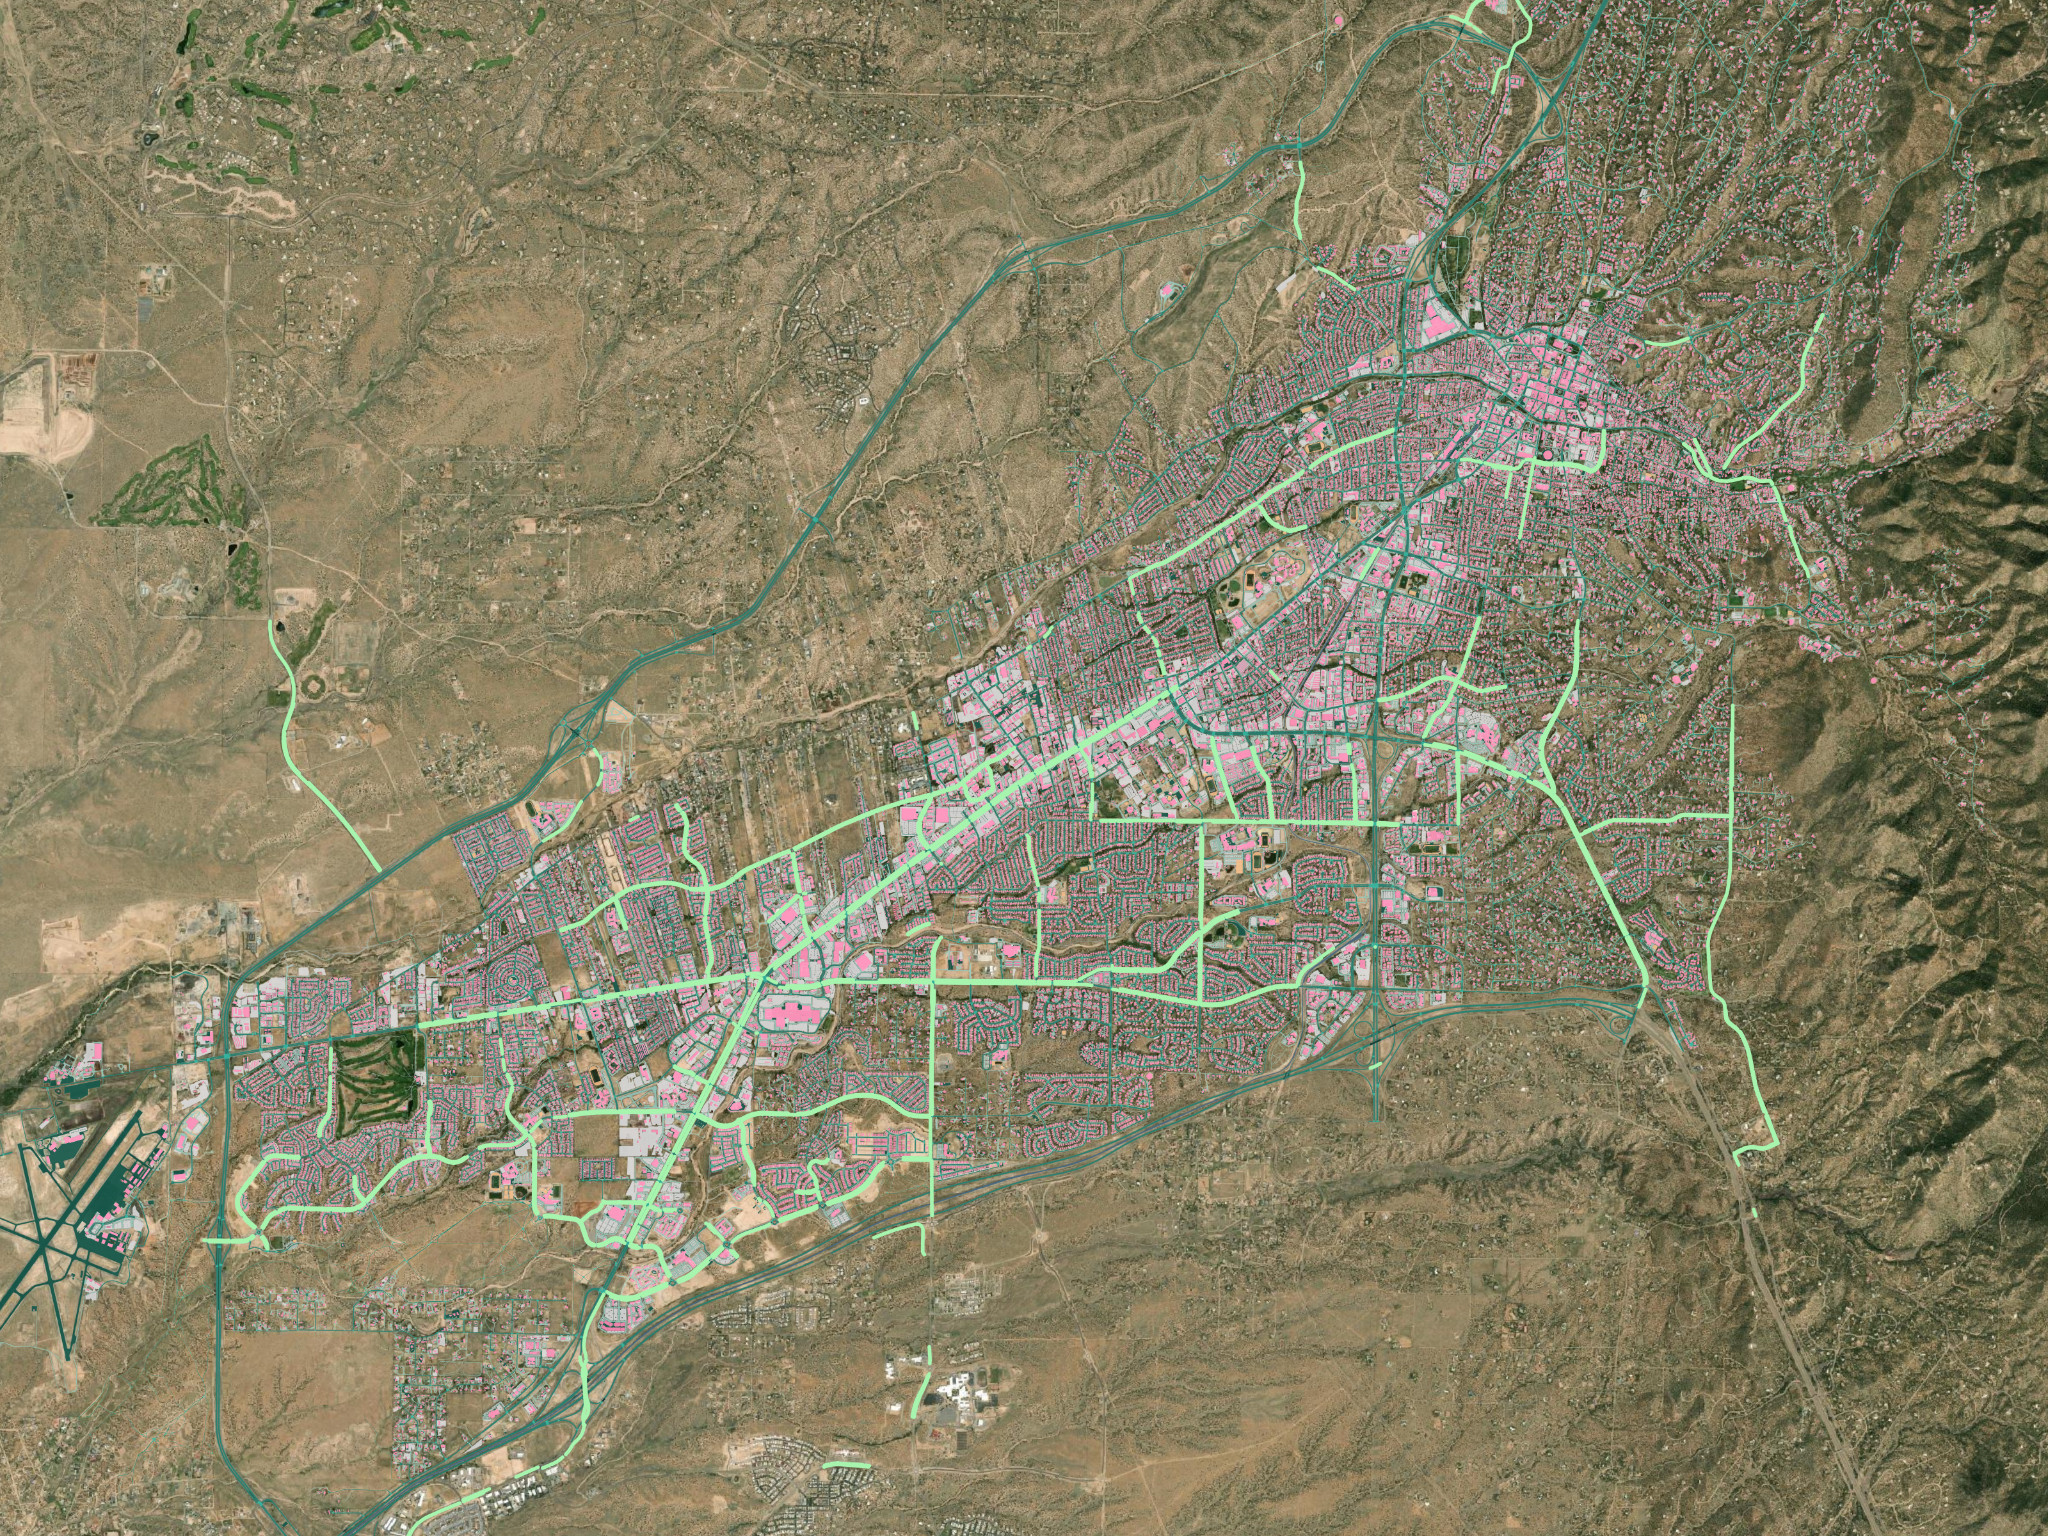
Signalized intersections without marked crosswalks. A third analysis started from the city’s 124 signalized intersections and kept the 24 with no marked crosswalk within 50 feet. A 300-foot search area around each one identified five with a pedestrian crash on record, six crashes in all, one of them fatal. The intersection of Alamo Drive and North St. Francis Drive ranked first. There, the Ecopia road marking, median, and sidewalk layers were set against the crash records for that intersection, and the countermeasures that came out of it trace back to the MPO’s adopted Local Road Safety Plan, which names reflective backplates and pavement markings for this crash type.

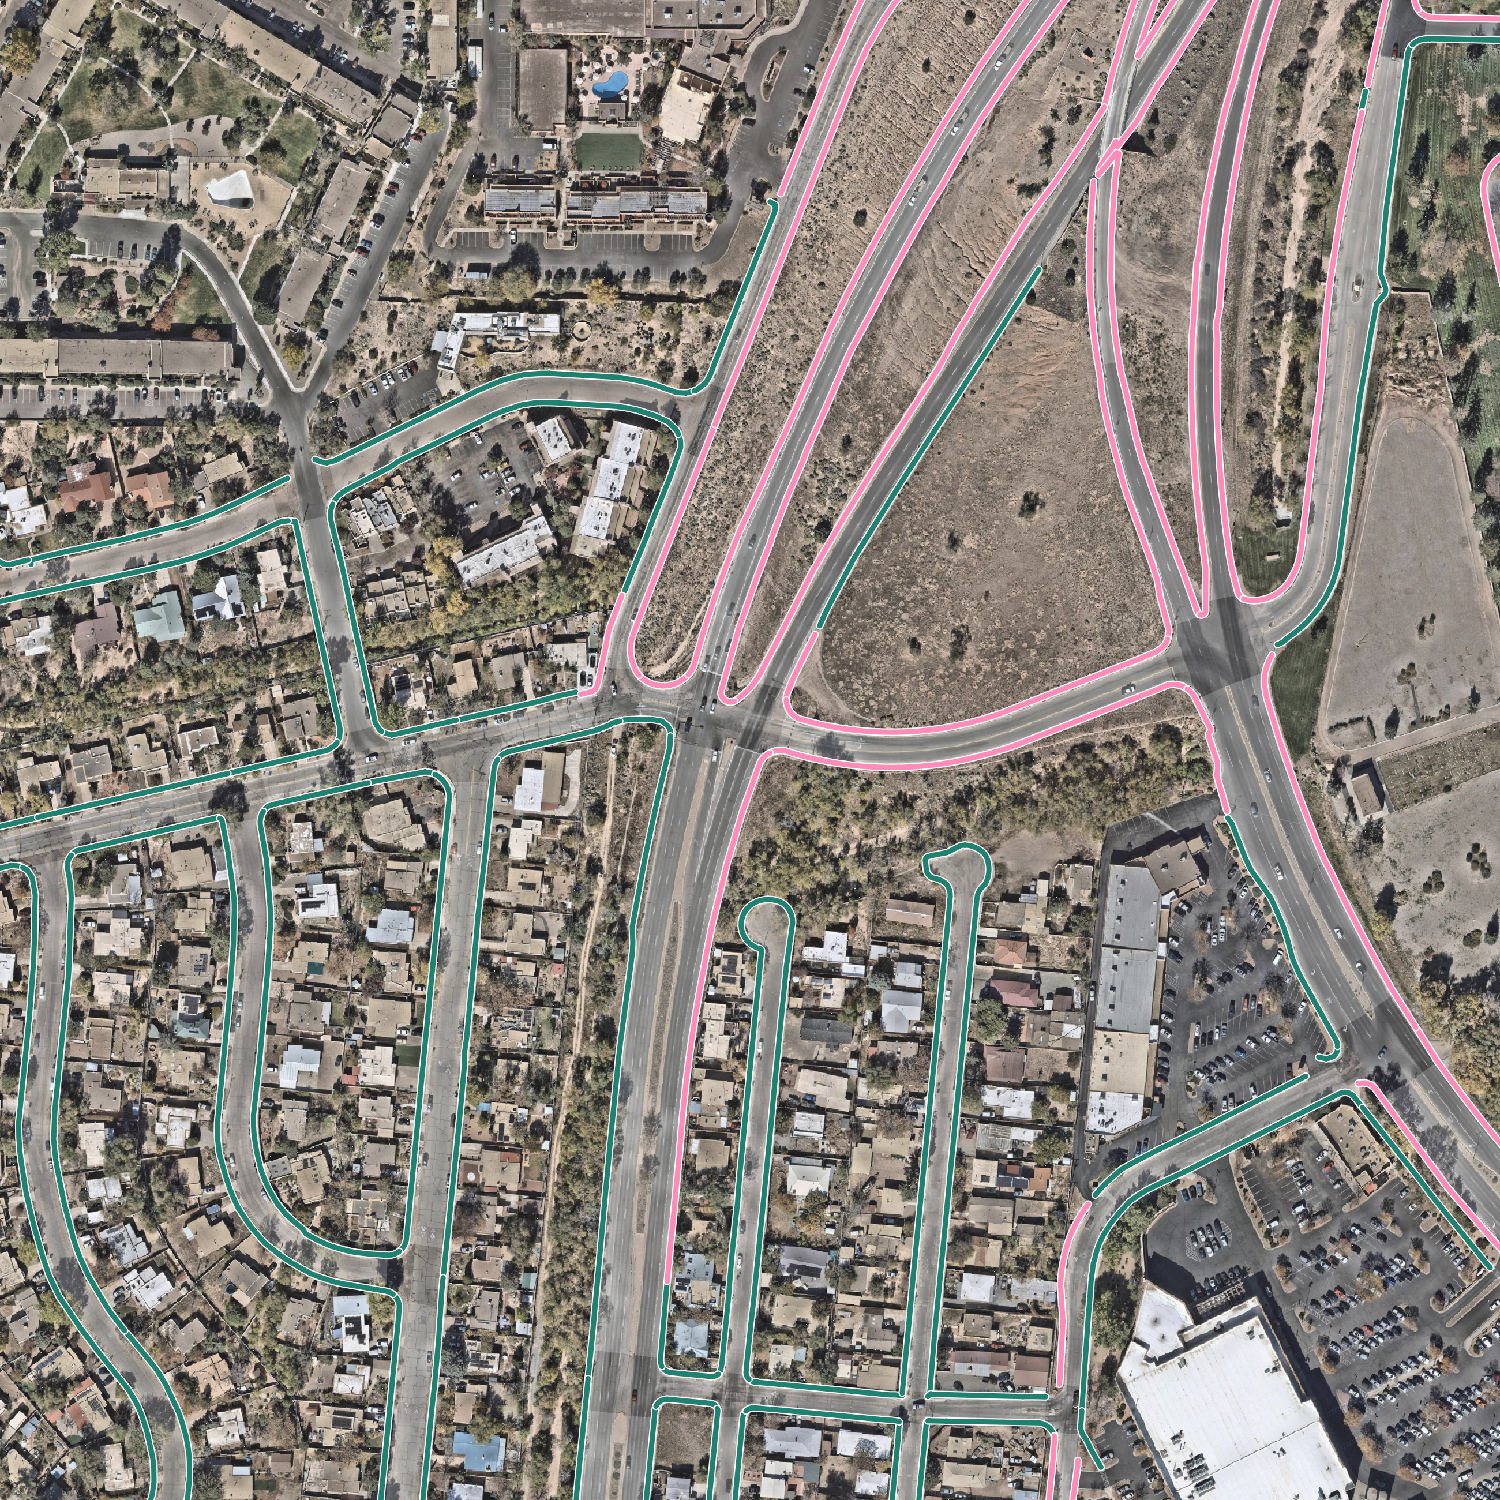
The right-turn lanes, the bicycle network, and the crosswalk gaps all come out of the same extraction. That is the practical case for an inventory over a study: the work of mapping the city is paid for once, and the people making decisions can keep asking questions.
Across the agency’s work with Waypoint over the past two years, and more recently with Ecopia, Aune estimates the three-person MPO has increased its output roughly 60% compared to five years ago, an assessment he has since presented to city council.
What’s next
The immediate priority is field verification. MPO staff will ground-truth the corridor analysis with photographic evidence, confirming that mapped sidewalk and crosswalk conditions reflect any work completed since the imagery was captured, before recommendations advance through licensed engineering review and the city decides how the safety-first framing shapes the capital program.
Beyond the bond corridors, the partnership has named St. Michael’s Drive as the next opportunity. The design update done there in August drew mainly on older studies, crash records, traffic counts, and funding paperwork, not the measured lane widths available in the Ecopia data. The plan is to build a verified record of what is on the ground before the next round of consultant work, so engineers spend their time comparing design options rather than working out what is already there. Further screens under consideration include sidewalk gaps near transit and schools, driveway density, crossing opportunities, and where a median refuge would make a crossing safer.
Because the Ecopia data is newly in place, measurable safety outcomes are still ahead. “It will be another year or so to have something you can really bite on,” Aune said. “But I guarantee in a year we’ll be doing a lot more with this.”
Santa Fe faces conditions that are common across MPOs of every size. Many have adopted safety policies but don’t yet have the data to put them into practice, or the staff and time to collect it by hand. Ecopia works with MPOs, transportation departments, and government agencies across North America to build the data foundation that makes safety-first planning practical and achievable.
To learn more about Ecopia’s transportation data solutions, get in touch with our team.
Ready to get started?
