
National Grid Modernizes Pipeline Safety Data with Ecopia AI
How National Grid corrected tens of thousands of outdated building records, uncovered thousands more that had never been mapped, and began laying the groundwork for its next official pipeline safety review using Ecopia AI.

How aging building data puts pipeline safety compliance at risk
Every gas transmission pipeline operator in the United States is required to run class location studies. These studies measure the density of structures and people near a pipeline and determine the level of regulatory oversight, inspection frequency, and capital spending required to operate safely. The accuracy of a class location study depends entirely on the accuracy of the underlying building and land cover data. When that data is outdated or incomplete, operators risk misclassifying segments of their network, leading to unnecessary spending in low-risk areas or, more critically, under-preparedness in high-risk ones.
National Grid, which operates gas transmission infrastructure across New York State, faced this exact problem. The company’s building data had not been meaningfully refreshed in years, even as new construction continued near its pipeline network. Getting the geometry right is only part of the challenge. National Grid also needs to know what each structure actually is.
“We need to know if a structure is a single family residence, or if it is a Walmart. That is very different from a risk perspective.” - Dean Pacilli, National Grid’s data analytics and engineering team
Challenge: four-year-old building data sourced county by county
National Grid has consistently run class location studies every year, but without the means to refresh building data accurately at scale, those studies relied on manual, small-scale building updates that were last comprehensively updated in 2020-21. This ultimately meant that National Grid’s data analytics and engineering team had to contact roughly 15 individual county GIS departments across upstate New York, reaching out to the parcel and tax centroid group in each one, since building records in the state are maintained at the county level rather than centralized statewide.
The resulting dataset was accurate for its time but static. Four years later, new construction near the pipeline network had gone undetected, and the underlying building shapes themselves showed clear quality issues. Some structures appeared as duplicates, most likely from an early digitizing pass that was never fully corrected in a later one. Others were shifted several feet from their true location. On their own, these might look like small errors, but because class location is based on structure counts within a set distance of a pipeline, a handful of duplicated or misplaced buildings can be enough to push a segment from one class into a more severe one, meaning more required inspections and more capital spent on work that the actual conditions on the ground never called for.
“We were no longer getting an accurate representation of what buildings actually existed within our network.” - Trevor Kapuvari, National Grid’s data analytics and engineering team
[slider]
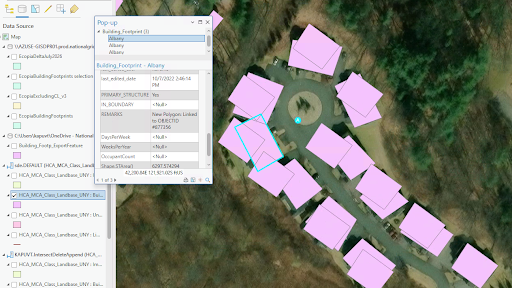
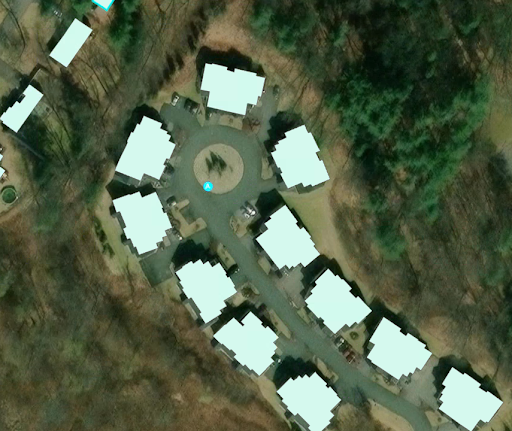
National Grid’s original building data (pink) shows duplicated, overlapping buildings. Ecopia’s data (green) defines individual buildings with greater accuracy and detail.
For assessing pavement and other impervious surfaces near the network, National Grid relied on the National Land Cover Database, a federal dataset built at 100-foot-by-100-foot resolution. In a dense area, a single 100-foot cell can span the equivalent of ten buildings, making it too coarse to reliably tell a driveway from a parking lot or a stretch of undeveloped land, exactly the distinction class location studies depend on.
Solution: a shape swap, then a search for what was missing
National Grid’s data analytics and engineering team, led by Dean Pacilli and Trevor Kapuvari, took a phased approach to bringing data from Ecopia AI (Ecopia) into its existing workflow rather than trying to replace everything at once.
Realigning structures with a shape swap
Wherever National Grid’s existing class location polygons and Ecopia’s building footprints agreed that a structure existed, the team replaced the outdated shape with Ecopia’s more accurate one while carrying over the attribution it already had. Across the network, this corrected the position and shape of roughly 39,000 buildings. In some cases the shift was only a few feet, but in aggregate, spatial shifts like these can be the difference between one class location and the next.
[slider]
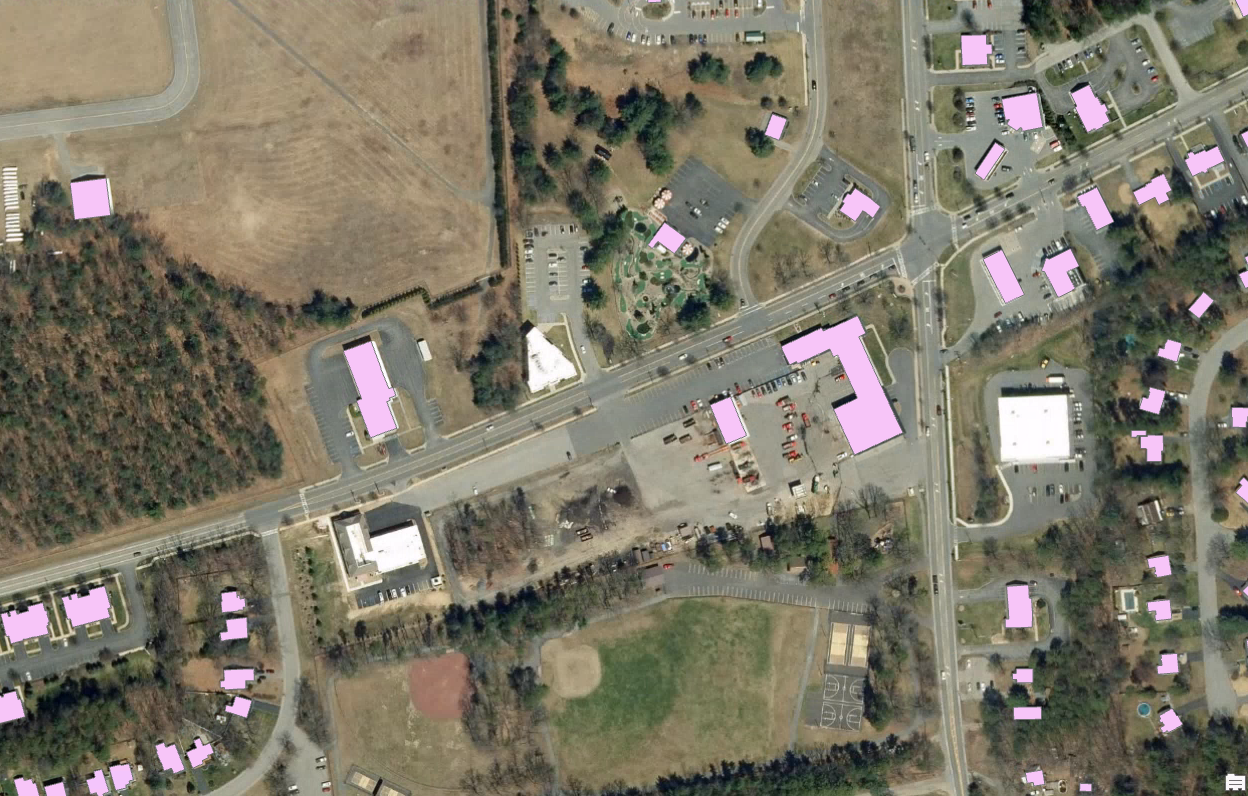
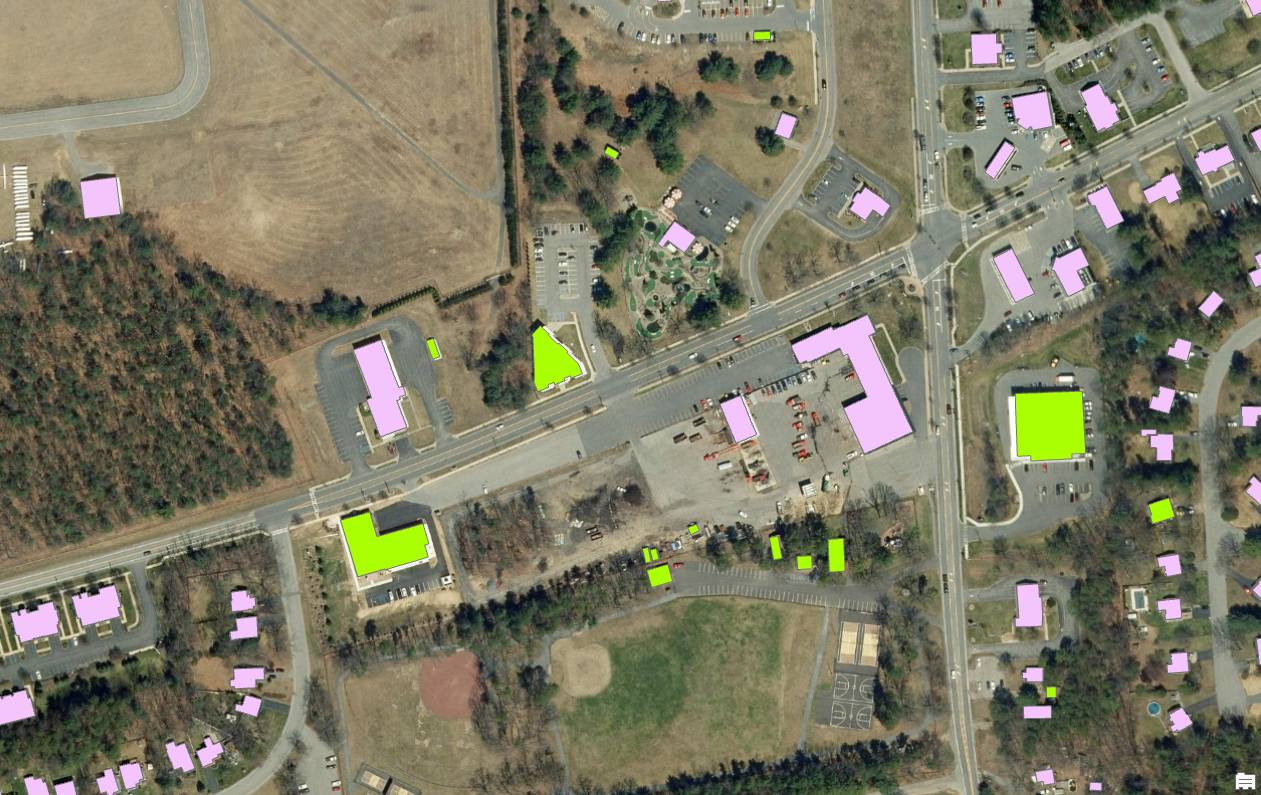
National Grid’s original building data (pink) was out of date and no longer reflected the building’s true shape. Ecopia’s data (green) brings it current, giving National Grid an accurate, up to date representation of the landscape.
In one case, Ecopia’s data identified a building that was not visible in the satellite basemap the team was using to cross check the results. When the team checked it manually, the structure was there.
“It actually outdoes what we see in the satellite imagery. It looked like there was nothing there but a golf course, but when we checked, the building was actually there.” - Trevor Kapuvari
[slider]

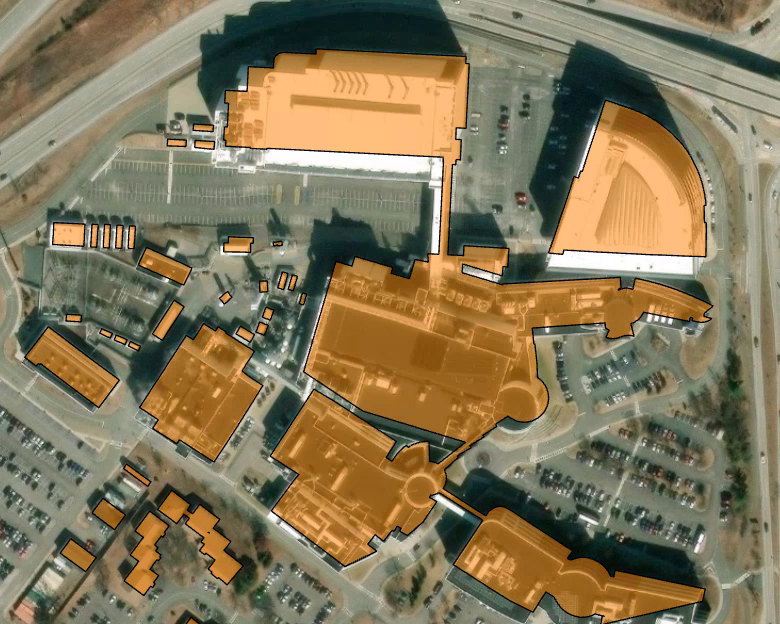
National Grid’s prior data (pink) treated an entire retail and office complex as one undifferentiated shape. Ecopia’s data resolves it into individually accurate building footprints (orange).
Surfacing buildings the old data missed entirely
Beyond correcting existing structures, National Grid used Ecopia’s annual delta updates to find what the old dataset had missed entirely. Over four years, roughly 14,000 new structures turned up near the pipeline network that were not part of the original land base at all. Of those, about 4,000 were confirmed to be primary structures, the sole, main building on a parcel, rather than sheds, garages, or other outbuildings that would not meaningfully change a risk classification on their own.

“We know that these structures Ecopia provides us are geospatially accurate. That is a huge case for Ecopia.” - Dean Pacilli
[slider]
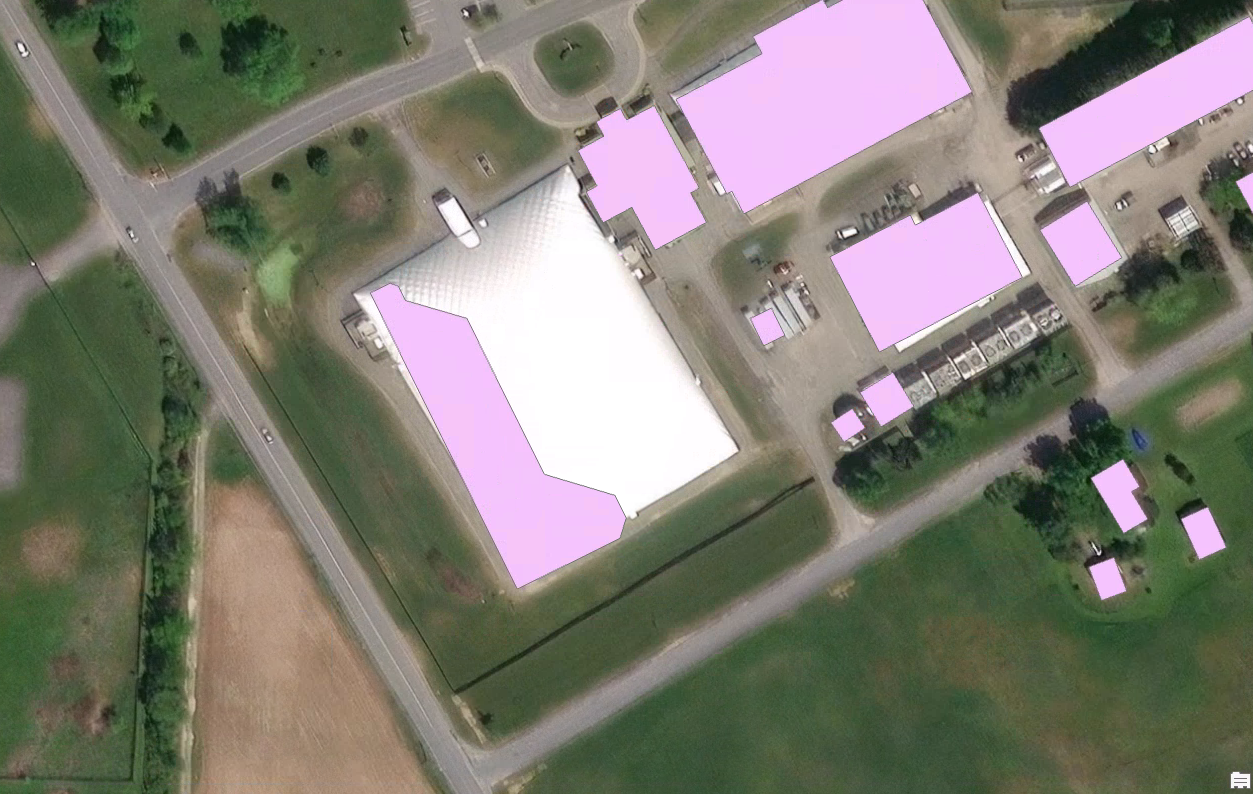
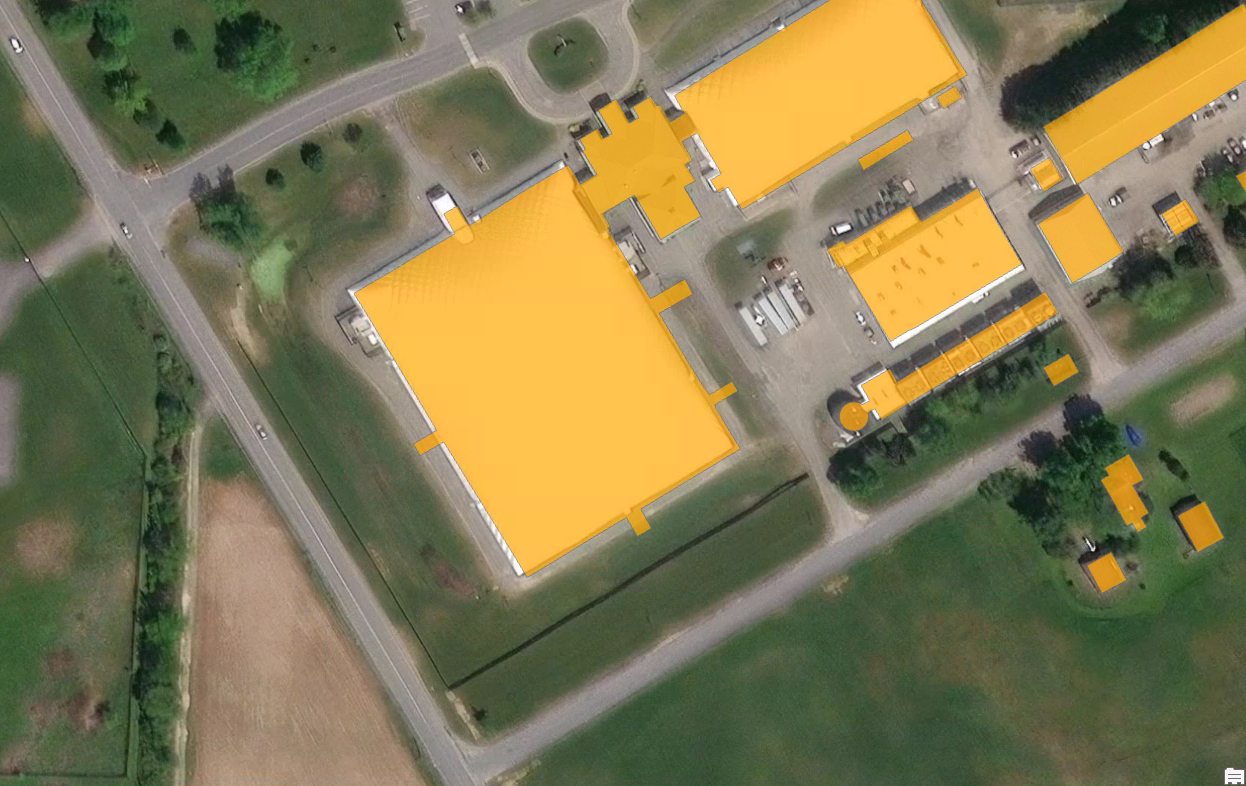
Pink shows National Grid’s existing footprints. Orange shows new structures Ecopia detected in its 2025 delta update, including one actively under construction.
Mapping wall-to-wall pavement for imperviousness
Ecopia’s land cover data gives National Grid a far more precise view of impervious surfaces than the federal 100-foot grid it relied on previously. That distinction matters for risk modeling because a gas leak behaves very differently underground depending on what is above it. In a farm field, gas can dissipate through the soil with relatively low risk. Under pavement in a dense, built-up area, the same leak has nowhere to go, and the risk classification needs to reflect that. Ecopia’s feature-level pavement data lets National Grid tell paved from unpaved ground at the resolution its risk modeling actually requires.
Solving for multi-height rooftops
One technical wrinkle the team flagged: Ecopia’s 3D building extraction workflow can split a single structure into multiple roof sections where height varies. That is useful for address-level geocoding on townhouses, for example, but not what National Grid needs for class location, where it inflates structure counts. Ecopia can deliver footprints without the roof splits, and the two teams are working out which output fits which National Grid use case.
Result: a documented, quantified case for a more current land base

- 8,500 miles of pipeline network covered by Ecopia’s building and land cover data
- ~39,000 buildings corrected in position through the shape swap process
- 14,000 new structures identified near the network over four years that were not in the prior land base
- 4,000 confirmed primary structures among those new detections, giving National Grid a clearer read on how much undetected construction had accumulated
Laying the groundwork for the next official submission
National Grid has not yet submitted an official, regulatory class location study using Ecopia’s data. The work so far has been validating the polygons with the transmission engineering asset teams who will ultimately use them, the group responsible for turning a corrected land base into an actual regulatory filing. That validation step matters: it is what turns a data correction exercise into something National Grid’s asset teams can stand behind once they do run their next official study. The shape swap and delta analysis have already given the team a documented, quantified case for how much its previous land base had drifted from reality, work that sets up whatever comes next rather than closing the loop on its own.
What’s next: building toward fully attributed class location studies
Polygon accuracy solves the geometry half of National Grid’s problem. The next phase of the partnership is focused on attribution, specifically four fields that determine how a structure factors into a class location study:
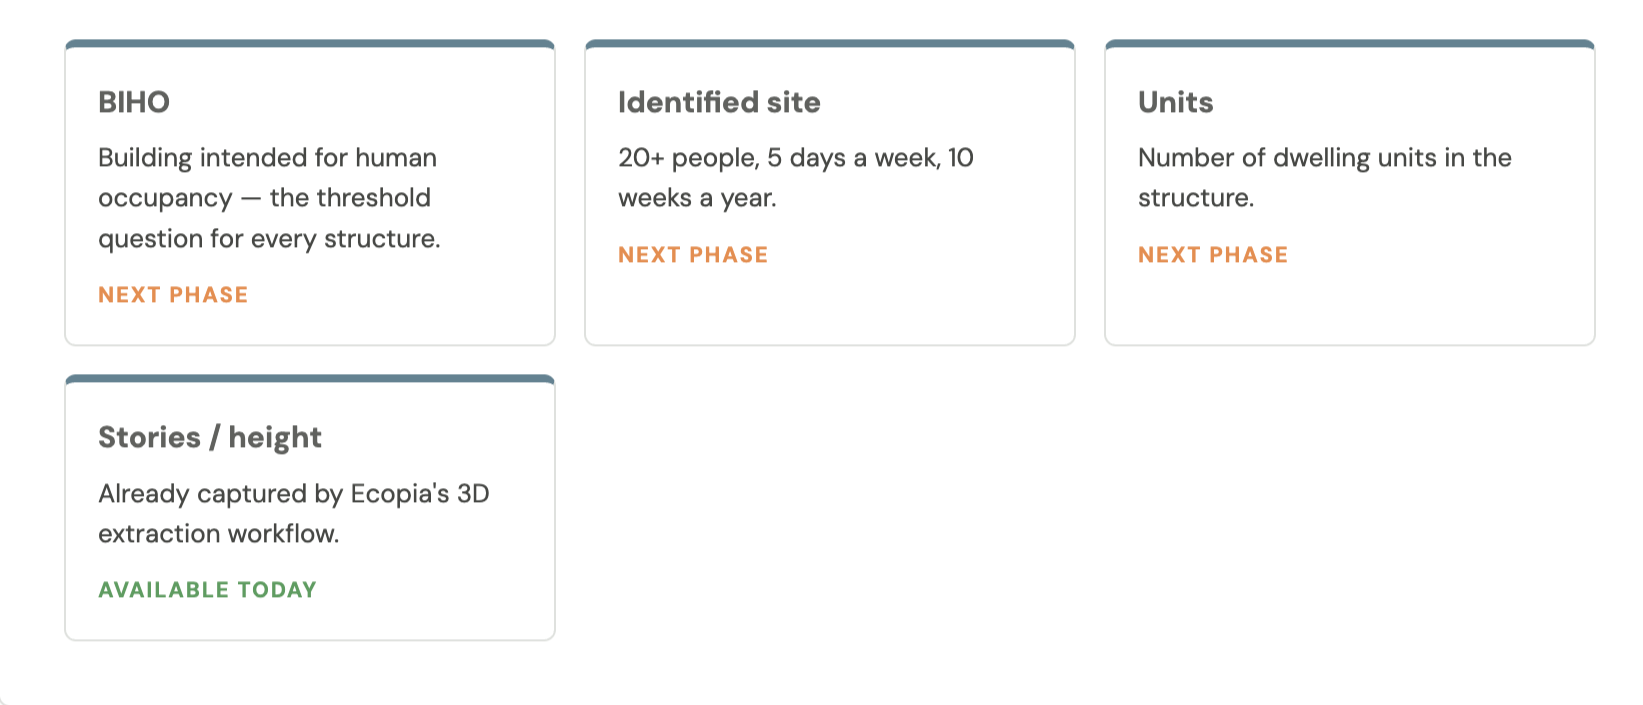
- Whether a structure is a building intended for human occupancy (BIHO)
- Whether it qualifies as an identified site (20+ people, 5 days a week, 10 weeks a year)
- Number of units within a structure
- Number of stories, or height
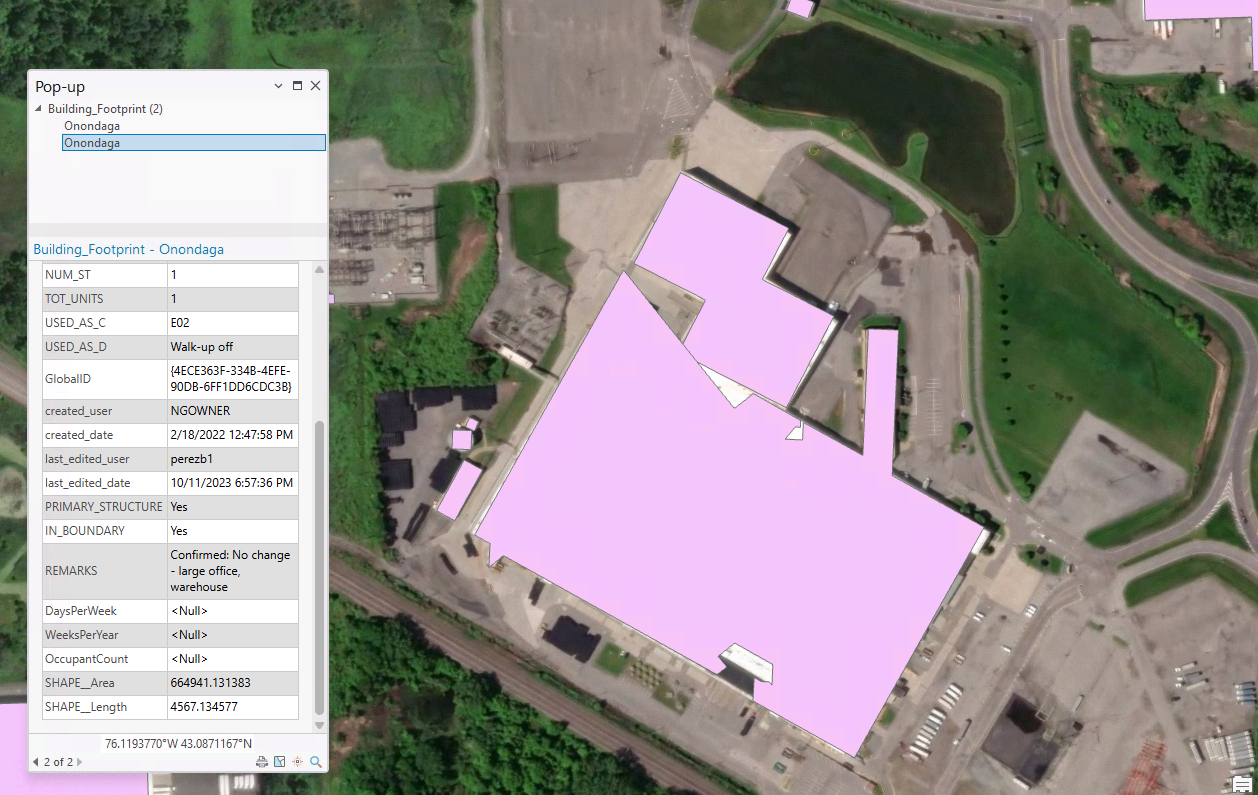
National Grid and Ecopia previously scoped a broader attribution partnership but paused it due to data quality gaps tied to counties that had not made their records available. Both teams see this as the natural next phase of the relationship, particularly given that Ecopia’s existing 3D extraction workflow already captures building height.
For National Grid, the work with Ecopia so far has proven out the foundation: a current, accurate, geospatially verified map of its service territory. From here, the team is looking at how richer attribution can turn that foundation into a fully proactive, annual class location workflow, rather than a periodic and reactive one.
Related reading
Want to see how Ecopia’s building footprint and impervious surface data can strengthen your organization’s risk and compliance workflows? Get in touch with our team.
Ready to get started?
