
Scaling Regional Planning Data Creation with AI Mapping
How Ecopia's AI mapping data helped CMAP improve road safety, model flood risk, and build a regional plan for 8.6 million residents across Illinois.

The Data Dilemma Facing Large Metropolitan Regions
Regional planning agencies across North America face a common problem: they are responsible for decisions that affect millions of people, but the data they need to make those decisions does not exist at the scale or quality required.
Across a large metro region, land cover records are inconsistent. Transportation infrastructure is mapped differently by each municipality. Building data is fragmented across many assessor databases. Creating and maintaining the underlying spatial data needed for flood risk modeling, safety investment planning, and employment forecasting is resource-intensive work, and keeping it current across a constantly changing built environment is a challenge that scales with every new development, road change, and land use shift.
This is the data gap that AI mapping technology addresses. By extracting detailed land cover and transportation features from high-resolution imagery at regional scale, it becomes possible to give planning agencies a consistent, current, and accurate view of the built environment, one that reflects what actually exists on the ground today.
In 2022, Ecopia AI (Ecopia) partnered with the Illinois Department of Transportation (IDOT) and the Chicago Metropolitan Agency for Planning (CMAP) to deliver a comprehensive AI map of northeastern Illinois. Three years later, CMAP's planners are using that data across transportation safety, flood risk modeling, and long-range socio-economic forecasting.
This case study looks at how CMAP is applying Ecopia's AI mapping data across four planning areas, and what it demonstrates about the real-world value of accurate, large-scale geospatial data.
- 4000+ square miles mapped
- 26 land cover and transport features
- 8.6M residents served
- 284 member municipalities
The Challenge: Coordinating Planning Data Across 284 Municipalities
CMAP is responsible for long-range planning across northeastern Illinois, the third largest metropolitan region in the United States. The agency serves 284 municipalities and 8.6 million residents.
Each of those 284 municipalities has its own mapping approach, varying levels of GIS capacity, and data that rarely aligns at regional scale. Stitching together a reliable, consistent picture of the region's transportation network, building stock, and land cover was a persistent challenge that left planners working with incomplete information.
The challenge was not just technical. It was also about timeliness. Manually digitizing features across 4,000 square miles would have required thousands of staff hours, and the resulting data would begin to age the moment it was complete.
“Before this partnership, pulling together consistent regional data meant reconciling dozens of different sources, each with its own gaps and quirks. It made regional analysis challenging and imprecise.” - CMAP Land Use Data Team
The Solution: A Comprehensive AI Map of Northeastern Illinois
Using AI-powered analysis of high-resolution aerial imagery, Ecopia extracted 26 distinct land cover and transportation features across the full coverage area. Where traditional digitizing methods require technicians to manually trace features from imagery, a process that can take months for a project of this scale, Ecopia's AI map engine automates extraction across large geographies at consistent accuracy. The result is comprehensive, high-resolution vector data delivered in weeks rather than months, and a workflow that can be repeated as the built environment changes rather than treated as a one-time effort.
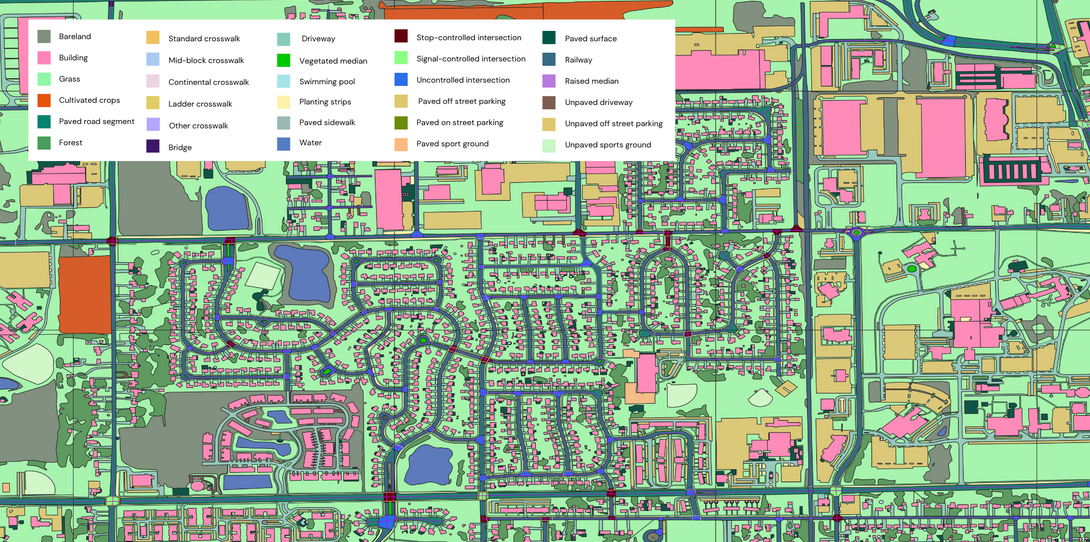
The resulting dataset gave CMAP and every metropolitan planning organization (MPO) in Illinois a consistent, current data foundation, covering everything from individual crosswalk types and painted bike lanes to building footprints, impervious surfaces, and surface parking across 4,000 square miles of northeastern Illinois. The dataset includes:
- Roads, intersections, medians, and turn lanes
- Sidewalks, crosswalks with type classification, and pedestrian refuge islands
- Painted bike lanes and other bicycle facility types
- Surface parking lots
- Impervious surfaces including roads, rooftops, and hardscaped areas
- Building footprints covering 3.1 million structures
IDOT's decision to extend access to every MPO in the state amplified the impact, giving planning organizations across Illinois access to the same consistent dataset.
The Result: Four Planning Applications Now Possible at Regional Scale
The use cases CMAP has developed for the data were not all anticipated when the partnership was formed. They emerged because the data was accurate, current, and detailed enough to support analysis that was not previously possible on a regional scale. Here are four areas where the impact has been most significant.
Bicycle and Pedestrian Network Analysis
Prior to this dataset, CMAP relied on individual bicycle and pedestrian plans or inventories across many counties and cities. That dataset did not always capture painted bike lanes, and sidewalk data at regional scale was often out of date.

Road Safety Analysis
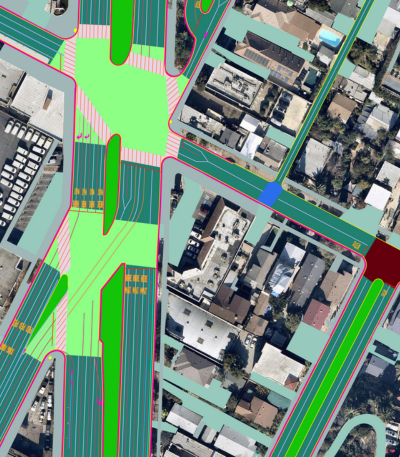
CMAP is using Ecopia's transportation features to analyze pedestrian safety conditions at a granular level. This includes crossing distances at signalized intersections, crosswalk type and visibility, conflict points between vehicle and pedestrian movements, sidewalk availability near high-risk locations, and opportunities for pedestrian refuge islands on wide arterials.
Overlaid with regional crash data, this analysis has been used to identify areas where certain roadway characteristics are increasing crash severity and risk in Rolling Meadows and in Palos Park.
[slider]

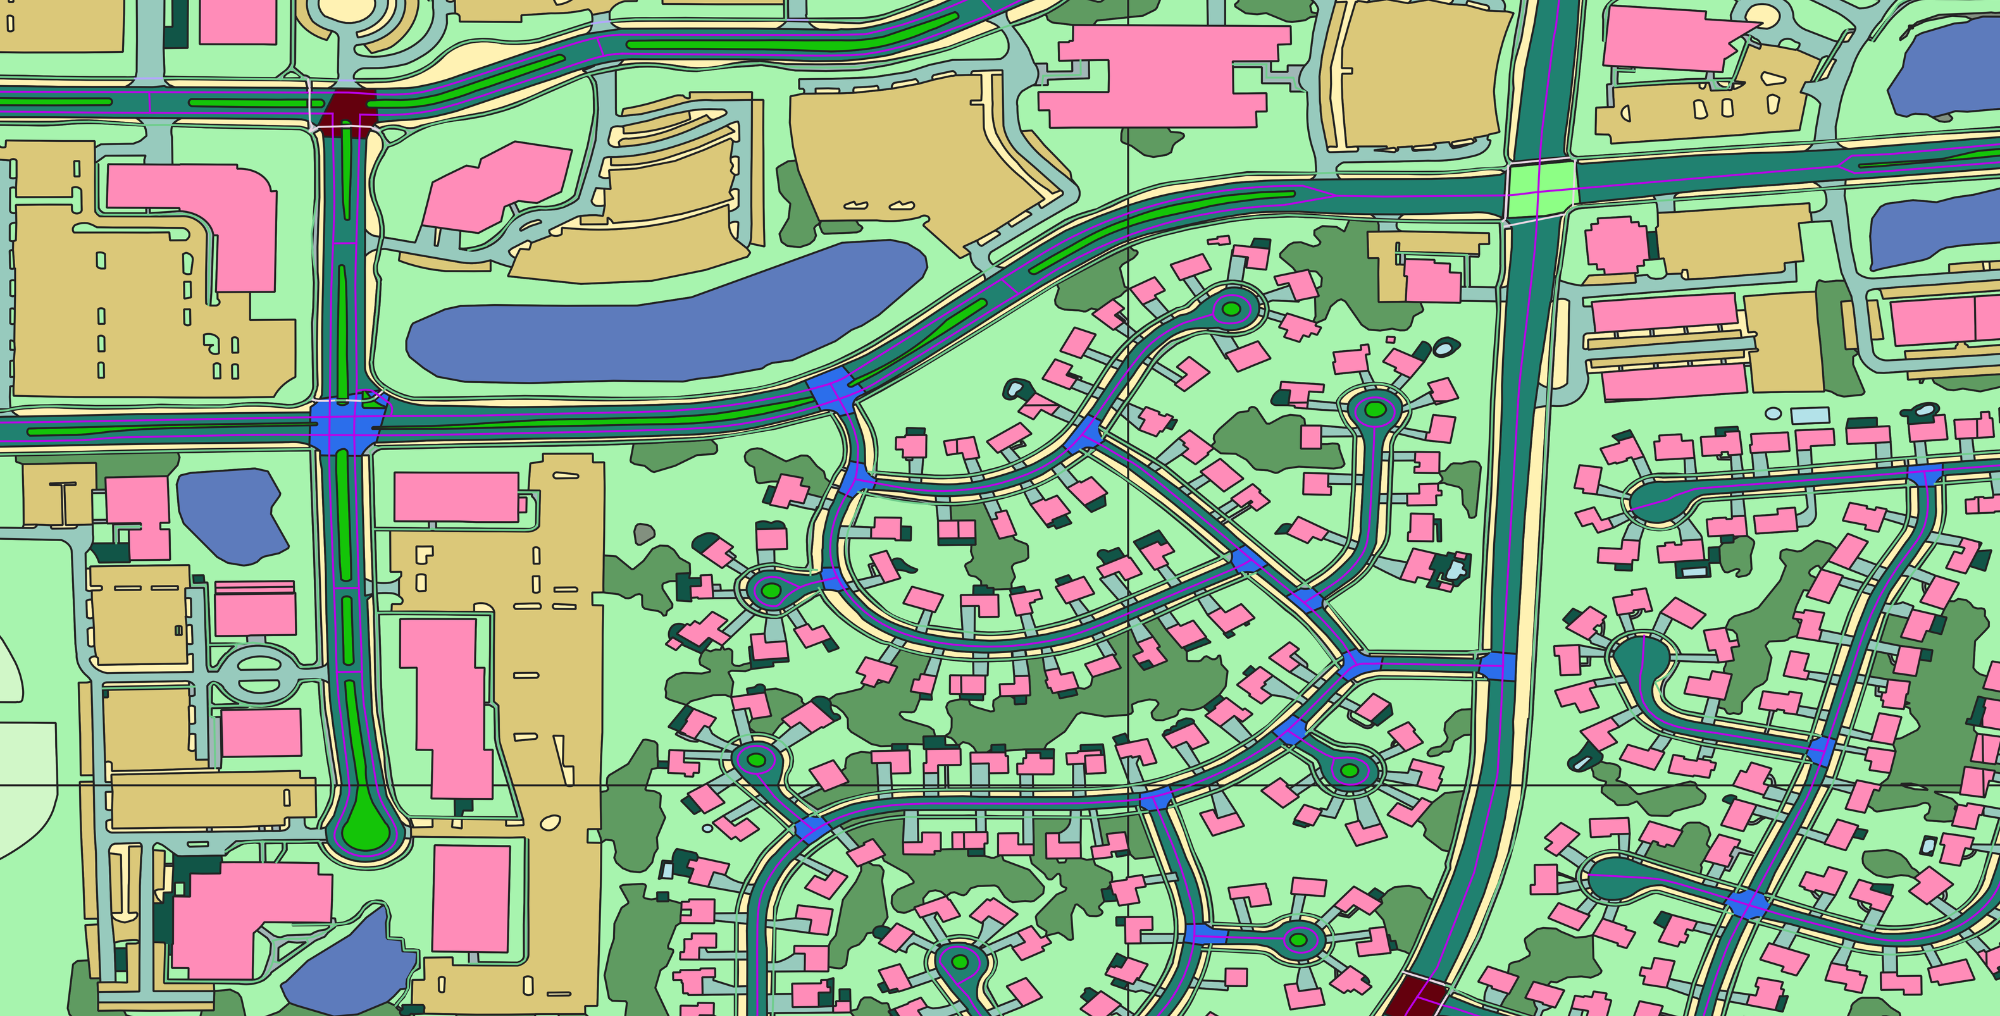
Ecopia's transportation features in a suburban Illinois neighborhood, showing intersection control types, crosswalk classifications, and road geometry used by CMAP planners to assess pedestrian safety conditions and identify high-injury network locations.
Flood Risk Modeling and Climate Resilience
Impervious surfaces are a primary driver of urban flooding. When rain falls on impervious ground, it cannot absorb and instead runs off, overwhelming stormwater systems. Accurately mapping those surfaces at regional scale is a critical part of flood modeling.
CMAP is using Ecopia's impervious surface data to interpret and apply regional flood models developed with engineering firm Geosyntec, which projects flooding scenarios under climate change conditions. This work found that 34% of roadways in the region are considered high flood risk.
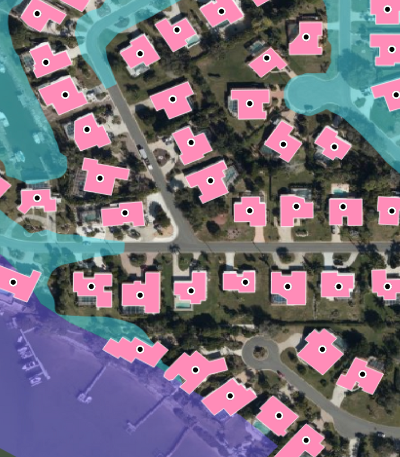
Ecopia's geocoded building data also solved a specific data problem for CMAP: turning hundreds of thousands of historical flood location addresses into precise geographic points. Because the underlying data was sensitive, a third-party geocoding service was not viable. CMAP used Ecopia's 3.1 million building footprints to build a custom, secure internal geolocator that kept data in-house while delivering the spatial accuracy needed for analysis.

“Ecopia's building footprint data gave us the precision we needed to geocode sensitive flood records without relying on external services. That was a critical capability for this project.” - CMAP Climate Resilience Team
Building Inventory and Socio-Economic Forecasting
CMAP's long-range forecasting work requires an accurate picture of the built environment at regional scale. Ecopia's 3.1 million building footprints serve as the foundation for a regional building inventory covering over 2.3 million structures, each attributed with land use type, square footage, number of residential units, number of stories, year built, and assessed value.
That inventory supports zoning analysis, block-level employment modeling, and regional socio-economic forecasting. It benefits from knowing not just where buildings are, but what they are and how they are used.
What's Next: Expanding the Potential of Regional AI Mapping
The applications CMAP has developed represent what is possible when a planning agency has access to accurate, current geospatial data at regional scale. But the potential goes further.
Future applications include using turn lane length data for access management analysis, expanding the high-injury network analysis to additional corridors, and integrating updated imagery to keep the dataset current as the region changes. Each new application builds on the same foundational data, compounding its value over time.
The data challenges CMAP faces are common across every major metropolitan region. Ecopia is working with planning agencies, transportation departments, and government bodies across North America to build the kind of regional data infrastructure that makes this work possible everywhere.
If your organization is working through similar data gaps, explore how Ecopia's AI-powered mapping data works or get in touch to discuss your region's needs.
Ready to get started?
