
When Growth Outpaces Maps: Hamilton County’s GIS Solution
See how Hamilton County, Indiana went from 3 vector layers to 21 and unlocked annual building footprint updates using Ecopia AI in just 4 weeks.

How rapid growth creates a GIS data crisis for county governments
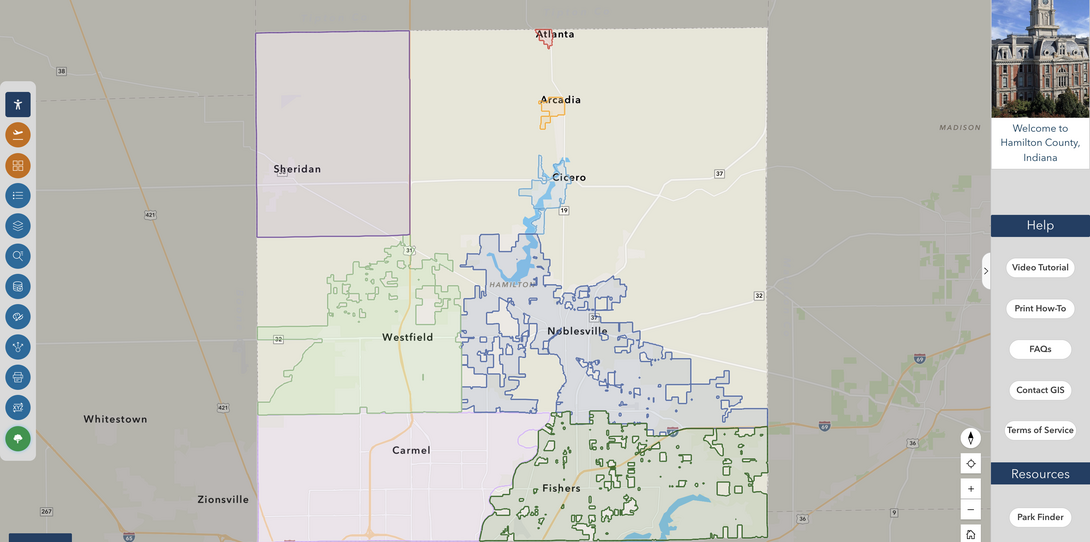
For county GIS teams across the United States, rapid population growth creates a compounding problem: the built environment changes faster than maps can keep up. New subdivisions, roads, and developments appear continuously, while traditional basemap update cycles run every four to five years. The result is a growing gap between what the map shows and what is actually on the ground, and that gap has real consequences for emergency services, flood risk modeling, stormwater planning, and community development.
Hamilton County, Indiana knows this challenge better than most. Ranked as the fastest-growing county in Indiana and 10th in the nation for population growth, Hamilton County has continued to expand rapidly. New subdivisions and buildings appear every year, and the county's GIS team was responsible for keeping maps current across all 402 square miles.
The county has long been a leader in geospatial data, acquiring 3-inch aerial imagery since 2017, well ahead of the industry standard. But despite the quality of its imagery, the county's vector data had not kept pace. By 2024, the county's usable vector layers had shrunk to just a handful: street centerlines, hydrography, and building footprints, each updated only every four to five years.
“I don't know how we did that in the past, waiting every four to five years for new building footprints,” said Joan Keene, GIS Director at Hamilton County. “We grow so much here. I just can't believe we did it.”
Challenge: going from 3 vector layers to a complete countywide land cover dataset
For Hamilton County’s 2024 basemap update, GIS Director Joan Keene and GIS consultant Philip Worrall set an ambitious goal: replace the county's limited vector dataset with a comprehensive, analysis-ready land cover map covering all 402 square miles. The 2024 Orthophotography, Lidar, and Basemap Update Project would offer ultra-high-resolution imagery for urban planning and emergency services, provide detailed elevation data for 3D modeling and flood risk analysis, use artificial intelligence (AI) to automate mapping of land cover features, and introduce 3D hydrography data for enhanced water resource management. The project also needed to align with a US Geological Survey (USGS) grant tied to the 3D Elevation Program (3DEP) and 3D Hydrography Program (3DHP), expanding the scope to include lidar and elevation data alongside the land cover extraction.
Before Ecopia AI (Ecopia), work like this had to be done entirely by hand, a process that would have taken years across a 402-square-mile area. AI offered a faster path without sacrificing the accuracy required to support mission-critical applications across public safety, emergency management, stormwater planning, and community development.
“The use of AI will help us better map changes in both man-made infrastructure and the natural environment,” said Keene. “Plus, it will provide unprecedented detail for those in emergency management and community planning while also aiding in flood risk analysis and precision agriculture.”
Solution: AI-based 3D land cover extraction delivered in 4 weeks
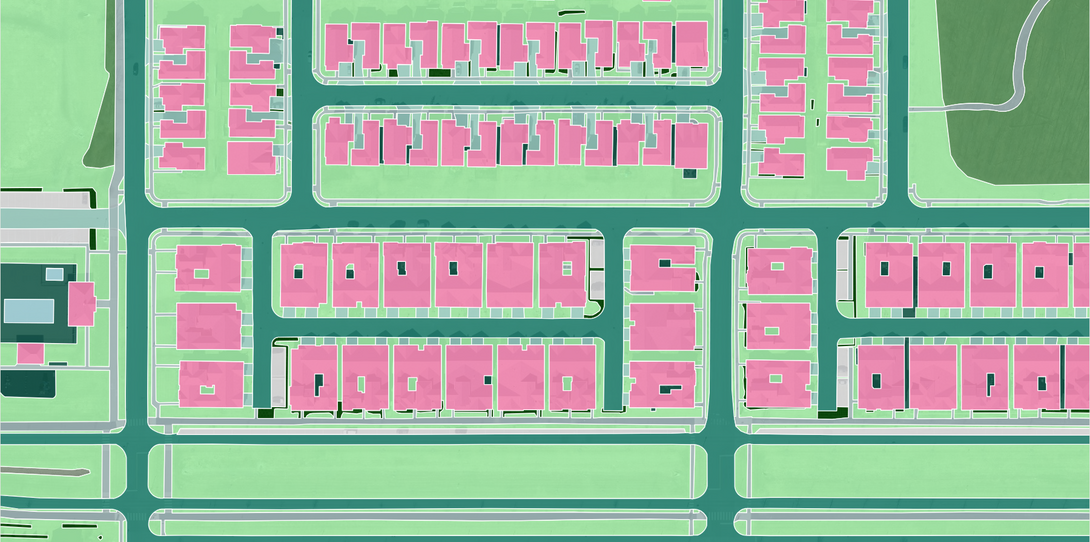
Hamilton County engaged Ecopia, through a partnership with Dewberry, to extract a countywide land cover dataset from its existing 3-inch aerial imagery using Ecopia’s AI mapping systems. Rather than assigning staff to manually digitize features, Ecopia's AI-based systems automatically extracted 21 distinct 2D and 3D map layers across the entire county in just 4 weeks.
The dataset went from 3 vector layers to 21, covering the full range of features the county needs across every GIS workflow:
Built environment layers: buildings, roads, driveways, parking lots, sidewalks, pavement, swimming pools, paved and unpaved sports grounds, bridges, and railways.
Natural landscape layers: open water, forest, overlapping tree canopy, shrubs, grass, bare land, and agricultural land.
3D layers: buildings, tree canopy, and bridges, providing vertical detail that 2D planimetric data alone cannot capture.

Ecopia also produced a land cover dataset for 2021, enabling a change detection analysis from 2021 to 2024. For the first time, Hamilton County had a quantified, data-driven picture of exactly how much the county had changed over that period. Between 2021 and 2024, the analysis detected 11,010 new buildings, 11,119 new driveways, and a 15% increase in swimming pools across the county, a tangible measure of just how much residential development had occurred between mapping cycles.


“Everyone always knew things were changing in Hamilton County,” said Philip Worrall, GIS consultant to Hamilton County. “But this was the first time we actually had a solid metric of exactly what was changing.”
Result: annual updates, a 3D viewer, and a new standard for county GIS
In 4 weeks, Ecopia delivered what would have taken years to produce manually. Hamilton County went from 3 vector layers to 21, and the dataset is now live on the county's GeoHub, freely accessible to the public. The impact has been felt across multiple areas.
Landscape and facility management in the City of Fishers
The countywide dataset extends beyond Hamilton County's GIS office. The City of Fishers put the land cover data to immediate operational use through its Department of Public Works (DPW), applying it to two maintenance challenges it had previously had no efficient way to address.
For road median maintenance, the DPW needed square footage breakdowns of grass, mulch, annuals, and other surface types for each median across the city to support maintenance scheduling and asset management. GIS staff performed geospatial analysis to identify median boundaries, aggregating bare land, forest, grass, and shrub land cover classifications to calculate total median area, then subtracting sidewalk and pavement polygons to isolate the treatable square footage. The median work is ongoing and the resulting data is being loaded into the city's asset management system.
For facility management, the DPW needed a polygon layer of maintained turf areas at city properties, parks, schools, and rights-of-way across approximately 50 properties. The department had previously hand-drawn these areas as highly detailed PDFs in an older system, but there was no usable GIS data. Rather than re-digitizing everything from scratch, the project team turned to Ecopia's land cover output. The grass classification closely matched the DPW's definition of common area turf, and the sports field classification matched existing sports field data extremely well. Those polygons were extracted, attributed by facility, and aggregated to produce total maintained square footage per property, significantly reducing the amount of manual digitizing required.
The results were delivered through an interactive dashboard where DPW staff can select any city-maintained facility and immediately view a breakdown of maintained area by type: common area, natural area, woods, landscape beds, right-of-way, and sports fields. By combining Ecopia's land cover data with other city datasets in a single interface, the dashboard gives staff the accurate, location-specific information they need to plan maintenance, schedule crews, and manage landscape contracts.
Annual building footprint updates
The most operationally significant countywide change is the shift to annual building footprint updates. Hamilton County has contracted directly with Ecopia for 2D and 3D building footprint updates through 2027. For emergency management, 911 routing, and public safety teams, having current building footprints every year rather than every four to five years has fundamentally changed how the county operates.
“Parking, driveways — that'll be important for public safety, to be able to see where they will need to go in case of an emergency,” said Keene.
3D mapping and visualization
Hamilton County was the first county in Indiana to launch a 3D map viewer, made possible by Ecopia's 3D building, tree canopy, and bridge data. The viewer is publicly accessible on the county's GeoHub alongside a 2D viewer, giving residents and staff a new way to explore the county's built environment.
ADA accessibility
To meet digital Americans with Disabilities Act (ADA) compliance requirements, Hamilton County created separate basemap galleries for ADA visual basemaps, orthoimagery, and general basemaps. The Ecopia land cover data powers two dedicated basemaps in the gallery: the Impervious Surface Basemap 2024 and the 2024 AI Change Detection basemap. Unlike aerial imagery, vector polygons can be recolored to meet ADA guidelines for people with visual impairments, making the data far more adaptable for accessibility purposes.

“You can't change the color of an image, but you can change the color of a polygon,” said Philip Worrall.
Community training and adoption
In 2025, Hamilton County ran 14 training sessions covering the new 2024 data, including dedicated sessions on the AI-generated land cover layers. To support adoption, the county also scheduled a series of informational webinars to educate GIS users in local government on the new geospatial data products. The data is now being used alongside lidar, ortho imagery, and elevation data across departments and municipalities countywide.
“Humans are still necessary, but this will make the layers that we need and the layers that we have not gotten before — it will be generated quicker,” said Keene.
Recognition and regional influence
Hamilton County received the 2025 Esri Special Achievement in GIS (SAG) Award at the Esri User Conference, recognizing its work in the county category for Indiana. The project was also covered by FOX59, featured in Geo Week News, and highlighted by EAASI. The county's experience has directly influenced neighboring jurisdictions: both Elkhart County and the Indianapolis MPO (Metropolitan Planning Organization) reached out to Hamilton County for a reference before signing their own contracts with Ecopia.
“Having a countywide land cover database is critical to ensure the safety and well-being of our residents. But for this information to be useful, it has to be complete, accurate, and up-to-date. By working with Ecopia's AI-powered systems, we have been able to map Hamilton County with more detail than ever before, in an unprecedented timeline.” - Joan Keene, GIS Director, Hamilton County, Indiana
What's next for Hamilton County and AI-powered county GIS
Hamilton County's journey reflects a challenge that fast-growing counties across the country face: the pace of development consistently outstrips the capacity of manual GIS workflows to document it. Every gap in the basemap is a gap in the decisions that depend on it, whether that decision is routing a first responder, managing a city's landscape contracts, or ensuring residents with visual impairments can access public mapping tools.
With annual contracts in place through 2027 and a growing library of AI-generated land cover data, Hamilton County is well positioned to continue expanding how it uses geospatial data across departments and municipalities. Hamilton County has shared news of obtaining the completed datasets with the Indiana Geographic Information Office (IGIO), the Indiana Geographic Information Council (IGIC), and the broader Indiana GIS community, and Keene and Worrall are actively sharing the county's experience with other Indiana counties.
“We're just really excited about sharing this information with everyone, simply because we realize this is going to be the first time within GIS that we'll be able to use AI machine learning for a lot of these layers,” said Keene.
For county GIS teams navigating the same pressure, Hamilton County offers a clear model: partner early, build the workflows around the data, and the value compounds year over year.
To learn how Ecopia AI supports local government GIS teams, get in touch with our team.
Ready to get started?
