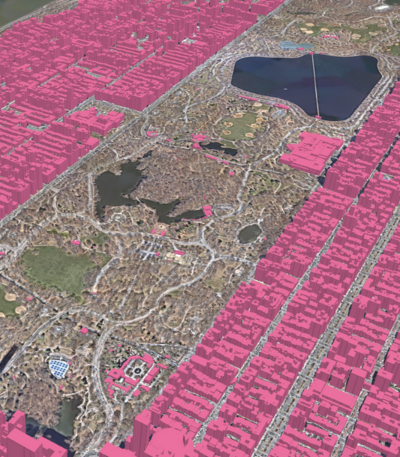
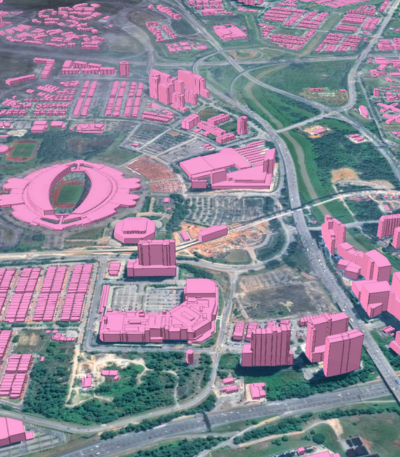
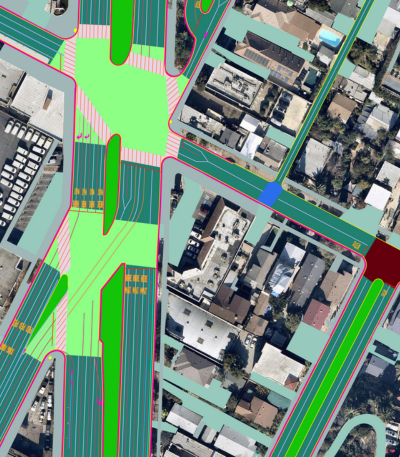

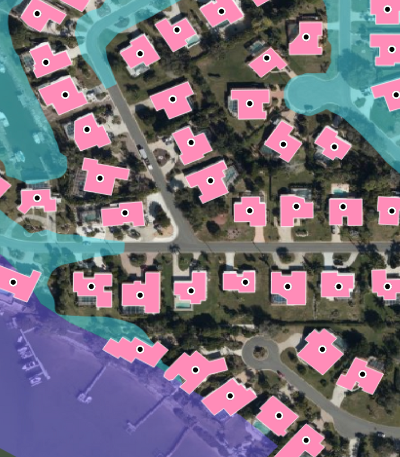
High-resolution aerial imagery allows organizations to see their communities with exceptional clarity. What they are often missing is the vector data that turns that imagery into something a stormwater engineer, an emergency dispatcher, or a broadband planner can actually use. That progression from imagery to actionable data was the focus of a recent webinar, Fast Forward Your Path from Imagery to Insight. During the session, Ecopia joined Eagleview’s Tim Horak and Elliot Cox to explore five ready-to-use data packs available through the Eagleview and Ecopia partnership.
A recording of the full session is available at the bottom of this page.
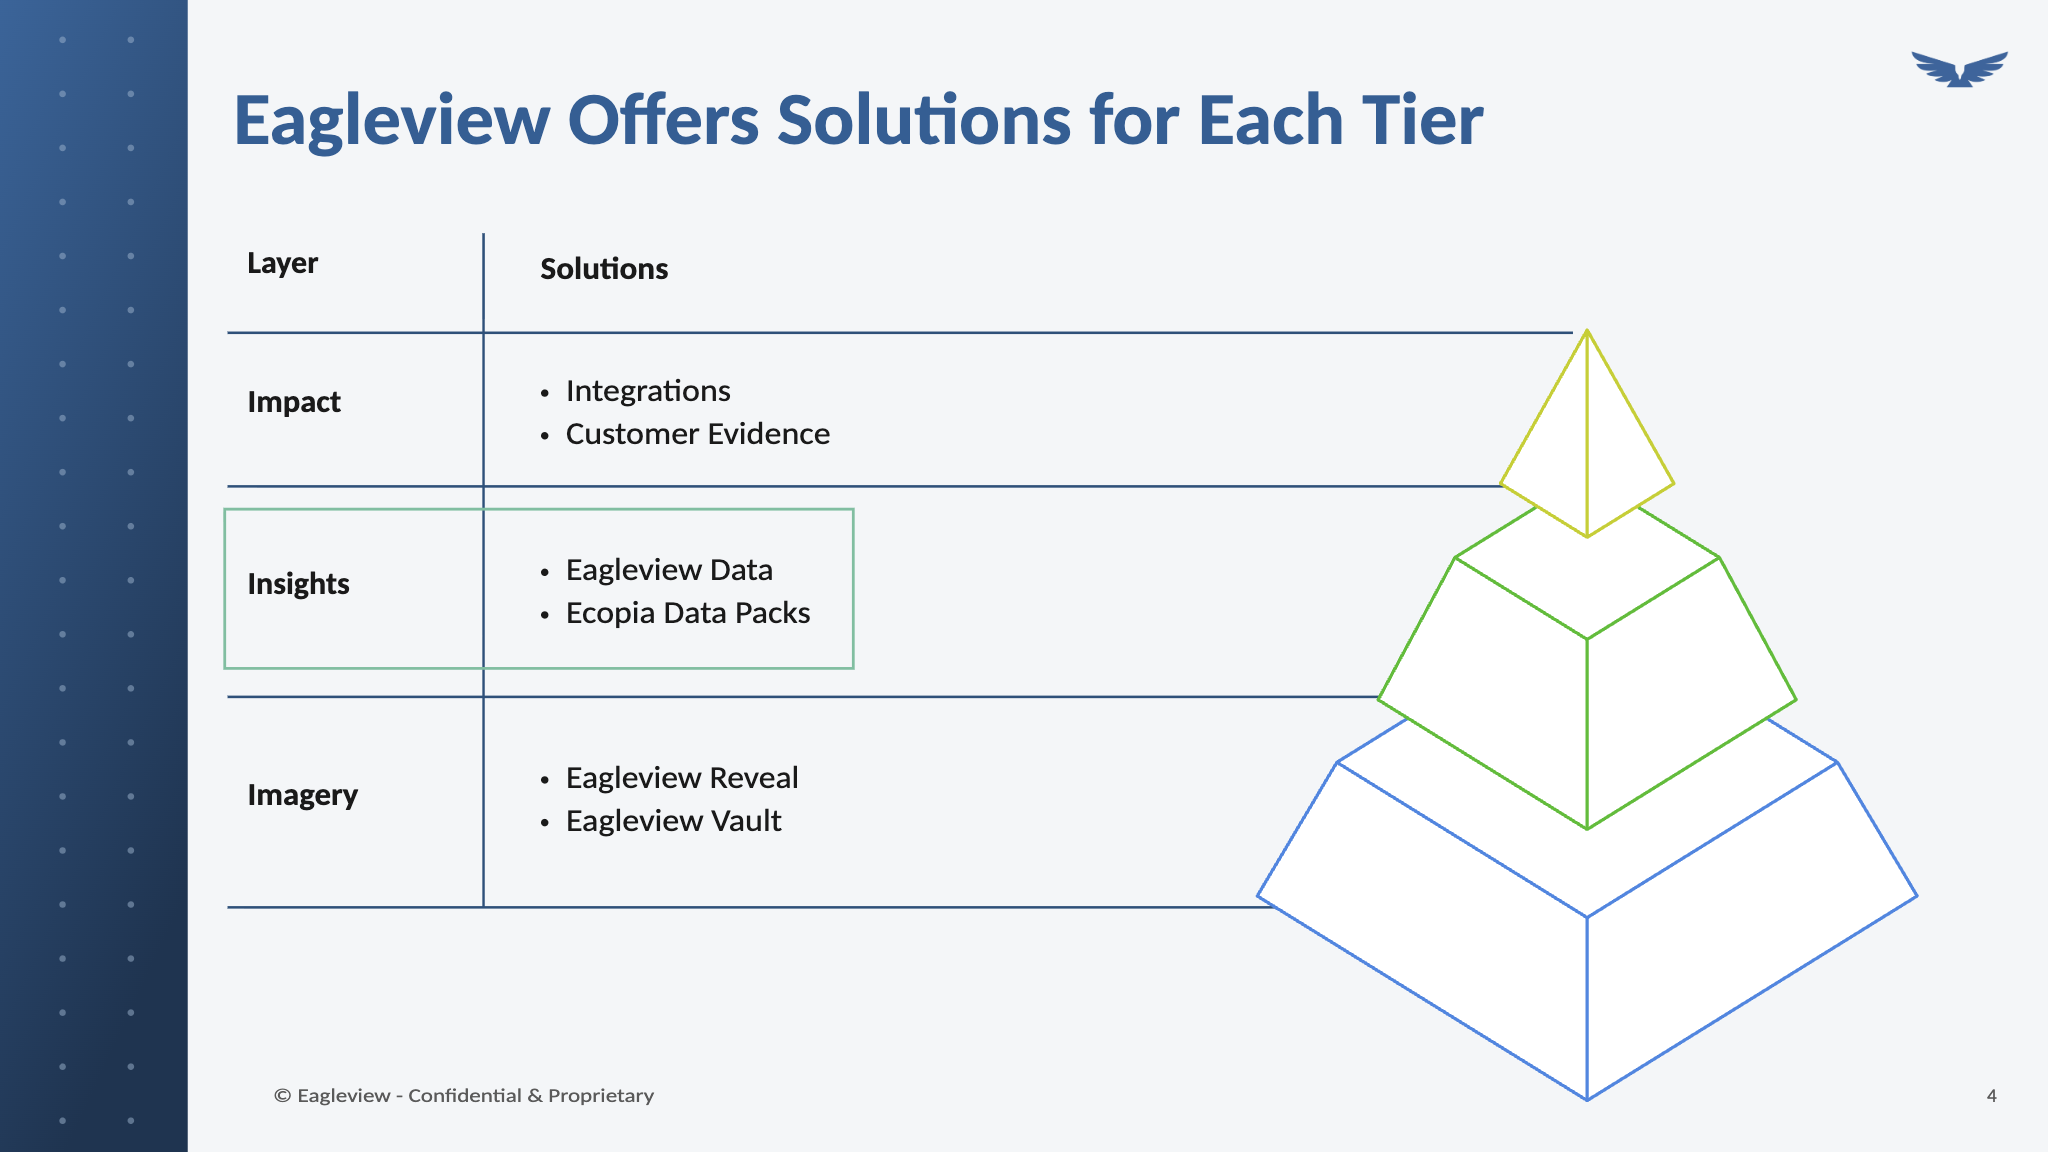
The data packs are a joint offering, combining Eagleview’s high-resolution aerial imagery with Ecopia’s AI-powered feature extraction to produce precise vector data depicting buildings, roads, sidewalks, land cover, and other features. The result is GIS-ready data that organizations can apply across a wide range of planning, analysis, and operational workflows.
The challenge of extracting vector data from imagery at scale
Organizations seeking to derive structured data from aerial imagery often encounter the same challenge: extracting detailed, consistent vector features across large geographic areas. Imagery provides the visual detail needed to investigate questions such as which properties have limited pervious surfaces or which building is closest to an emergency call, but answering these questions consistently and at scale often requires the features visible in the imagery to be converted into structured vector data.
Traditionally, the available methods have involved trade-offs. Manual digitization can be accurate, but factoring in staff time and salaries means it can quickly get expensive, and the resulting map is often stale before it is even finished. Relying on more than one person to trace features by hand also introduces inconsistency, since no two digitizers interpret the same imagery exactly the same way. That combination of challenges pushes many organizations toward open-source data or automated extraction tools instead, but those alternatives can vary in completeness and accuracy, leaving coverage gaps or geometry that does not align closely enough with the real world to support applications such as emergency routing or fee assessment.

Eagleview and Ecopia’s partnership is built to close that gap without forcing a choice between speed and accuracy. Higher resolution and more current imagery make the extraction process more reliable. Eagleview, whose imagery already covers 96 percent of the US population, captures high-resolution orthogonal and oblique imagery with ground sample distance (GSD) as fine as 1 inch (2.5cm), giving Ecopia a tremendous amount of detail to extract from per square foot of ground. Eagleview also flies and refreshes its imagery on a consistent capture cycle, providing a current, high-resolution foundation for Ecopia to work off of. That foundation is what makes precise extraction possible in the first place. Turning it into ready-to-use vector data at scale is the next step, and that is where Ecopia comes in.
Ecopia is on a mission to create a digital twin of the Earth. It now produces more than 75 layers of land cover and transportation vectors in 2D and 3D, extracting features across an entire US state in a matter of weeks, all with greater than 95 percent geometric accuracy. Ecopia’s team of expert map annotators review results through a multi-layered quality control system developed by geomatics professionals, a human-controlled step that Ecopia pointed to in the webinar as a key difference between them and newer, less mature automated mapping tools. Ecopia is bringing more than a decade of extraction experience to the Eagleview partnership. Read more about the Ecopia and Eagleview partnership.
The data packs in action
For each of the five data packs, the Ecopia team walked through an example of the capabilities of that category of data. These are drawn from Ecopia’s broader work with government clients to prove the data itself works at scale, rather than projects built on Eagleview imagery. Each is labeled accordingly as an Ecopia client example.
Impervious surface data: recovering millions in stormwater fee revenue
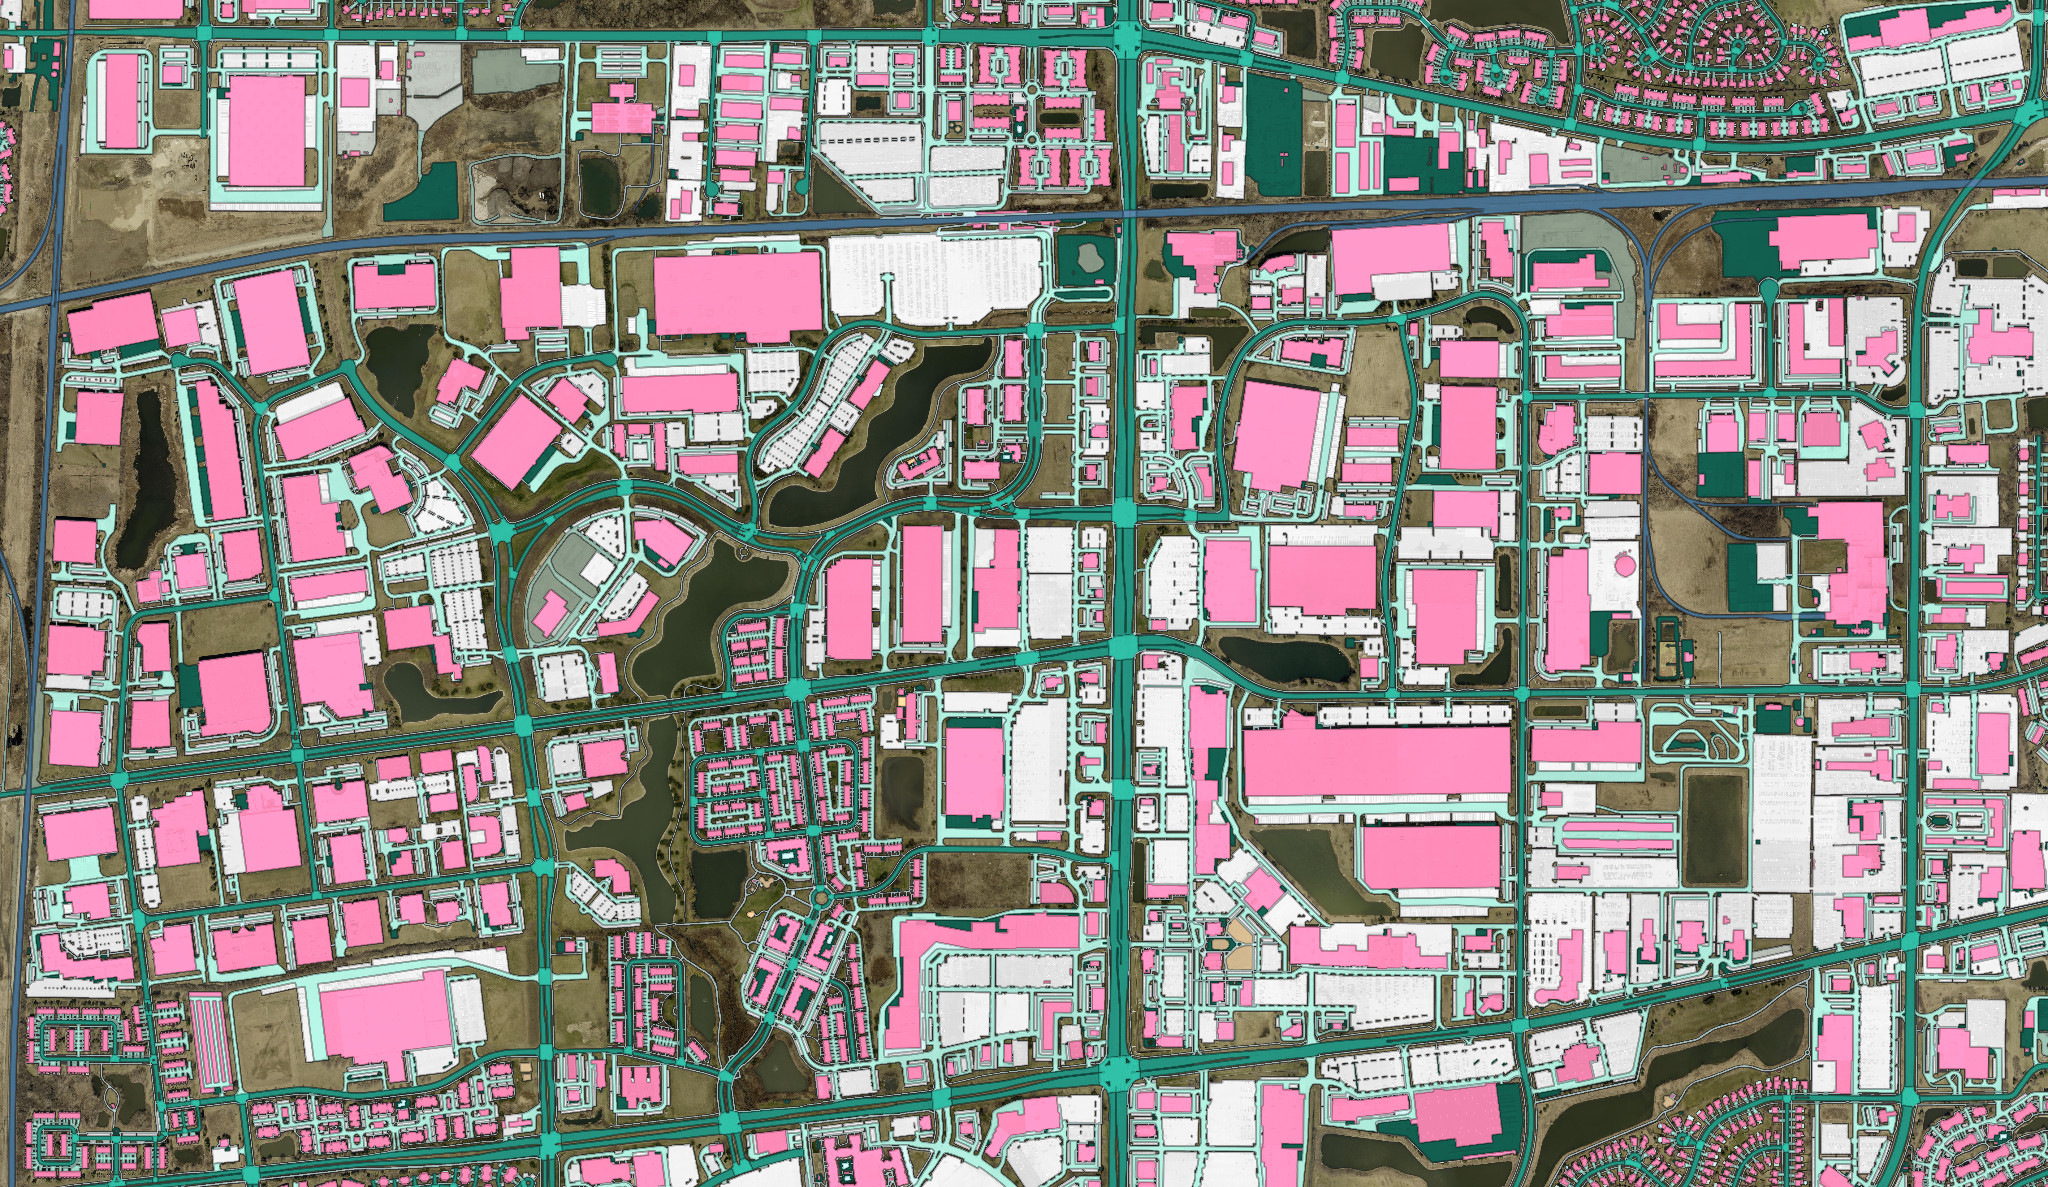
The impervious surface data pack includes 20 distinct feature classes depicting manmade surfaces that do not absorb water, such as pavement, rooftops, and driveways, all extracted by Ecopia from Eagleview imagery with greater than 95 percent geometric accuracy. It is the most requested of the five data packs, largely because so many cities use impervious surface area as the basis for stormwater utility fees.
Example from Ecopia’s client network: The City of Detroit spent 18 months manually digitizing impervious surfaces before turning to Ecopia. Ecopia delivered the same citywide dataset in four weeks. With annual, up-to-date data from Ecopia, the Detroit Water and Sewerage Department discovered that impervious surface area across the city was changing at a rate of about 2 percent per year, a shift significant enough to uncover a $5.6 million discrepancy in stormwater fee revenue. Detroit now receives annual updates from Ecopia and has since added Ecopia’s natural features data to strengthen its stormwater runoff modeling. Read the full Detroit stormwater case study or explore Ecopia’s 3D Land Cover product.
Transportation data: mapping pedestrian infrastructure at regional scale
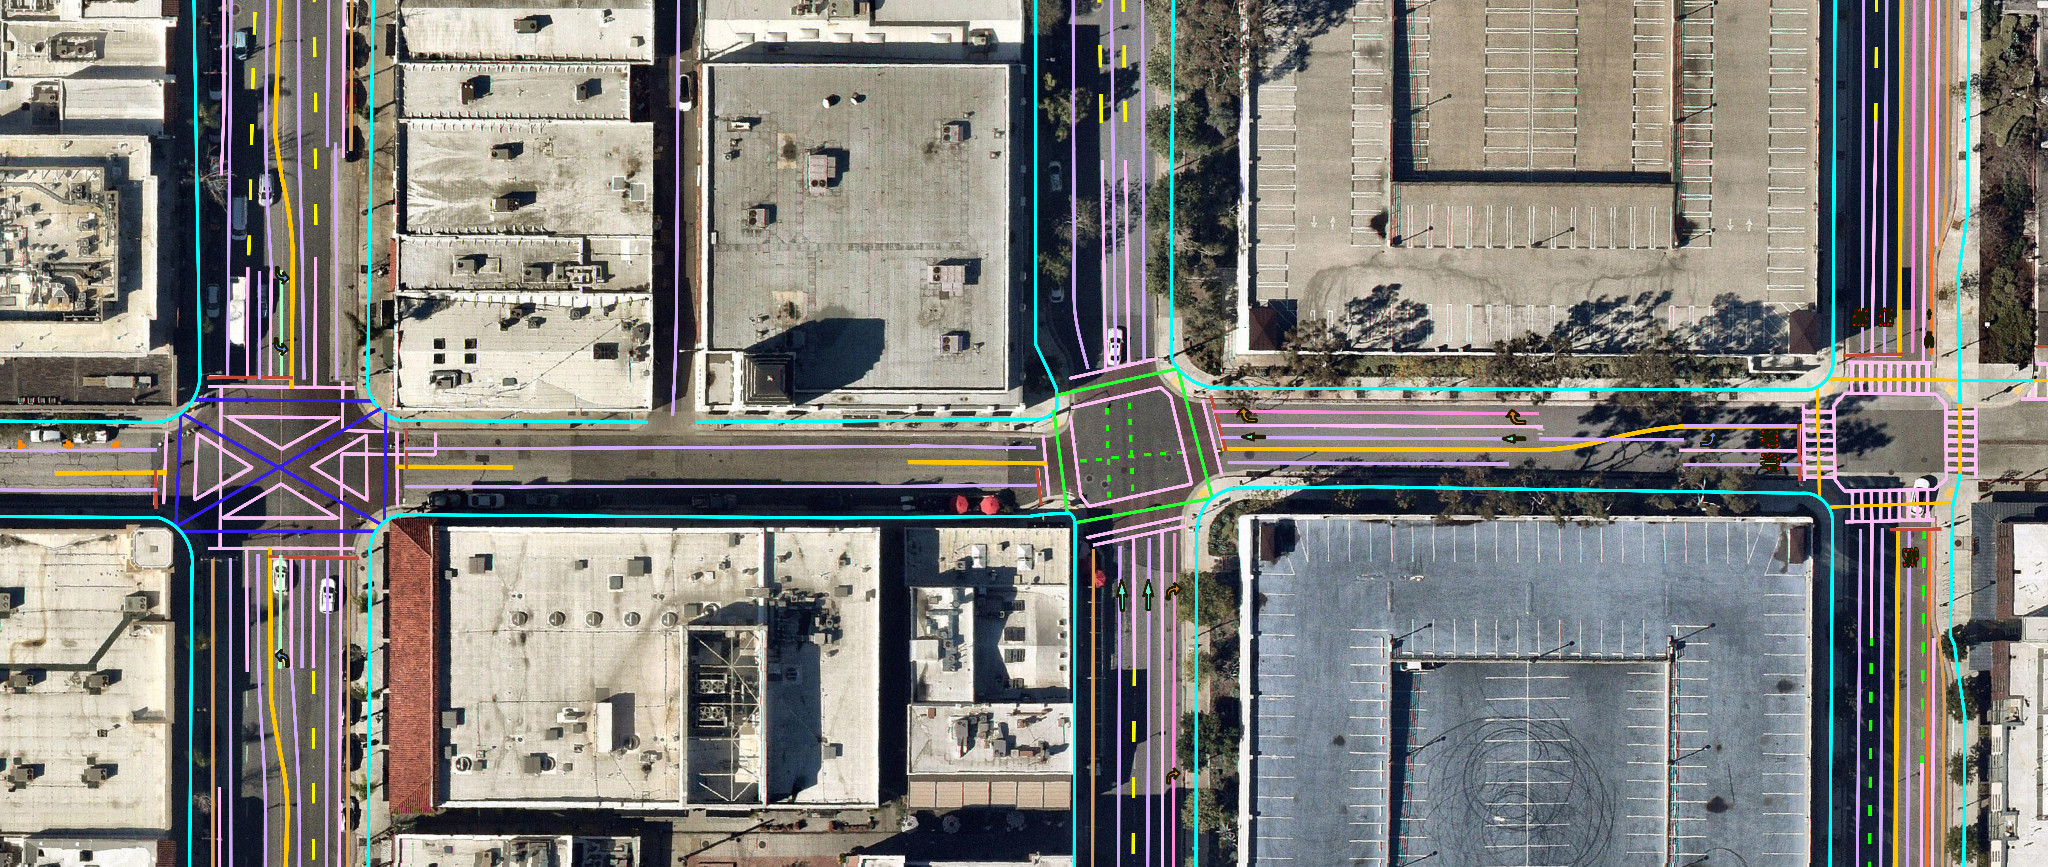
The transportation data pack is one of the newer additions to the Eagleview and Ecopia lineup, with 33 distinct feature classes that go well beyond road centerlines to include sidewalks, crosswalks, and even lane paint striping. Governments use it for transportation planning, ADA compliance, right-of-way analysis, and 911 emergency response.
Example from Ecopia’s client network: The Southeast Michigan Council of Governments (SEMCOG) needed a complete sidewalk, crosswalk, and parking lot inventory across a 5,000 square mile, 13 county region, a project that would have taken years to complete by hand. Ecopia delivered it in three weeks, extracting more than 24,000 linear miles of sidewalks and crosswalks across the region, adding width and crosswalk type attribution along the way. The resulting data showed that only 23 percent of crosswalks in the region were marked and that just over three quarters of the population lived within 100 feet of the nearest sidewalk, insights SEMCOG is now using to prioritize pedestrian infrastructure investment. SEMCOG has since expanded its relationship with Ecopia to include land cover data supporting its stormwater and green infrastructure goals. See how Ecopia supported SEMCOG’s transportation planning or learn more about Ecopia’s Advanced Transportation Features.
Land cover data: one dataset serving five departments at once
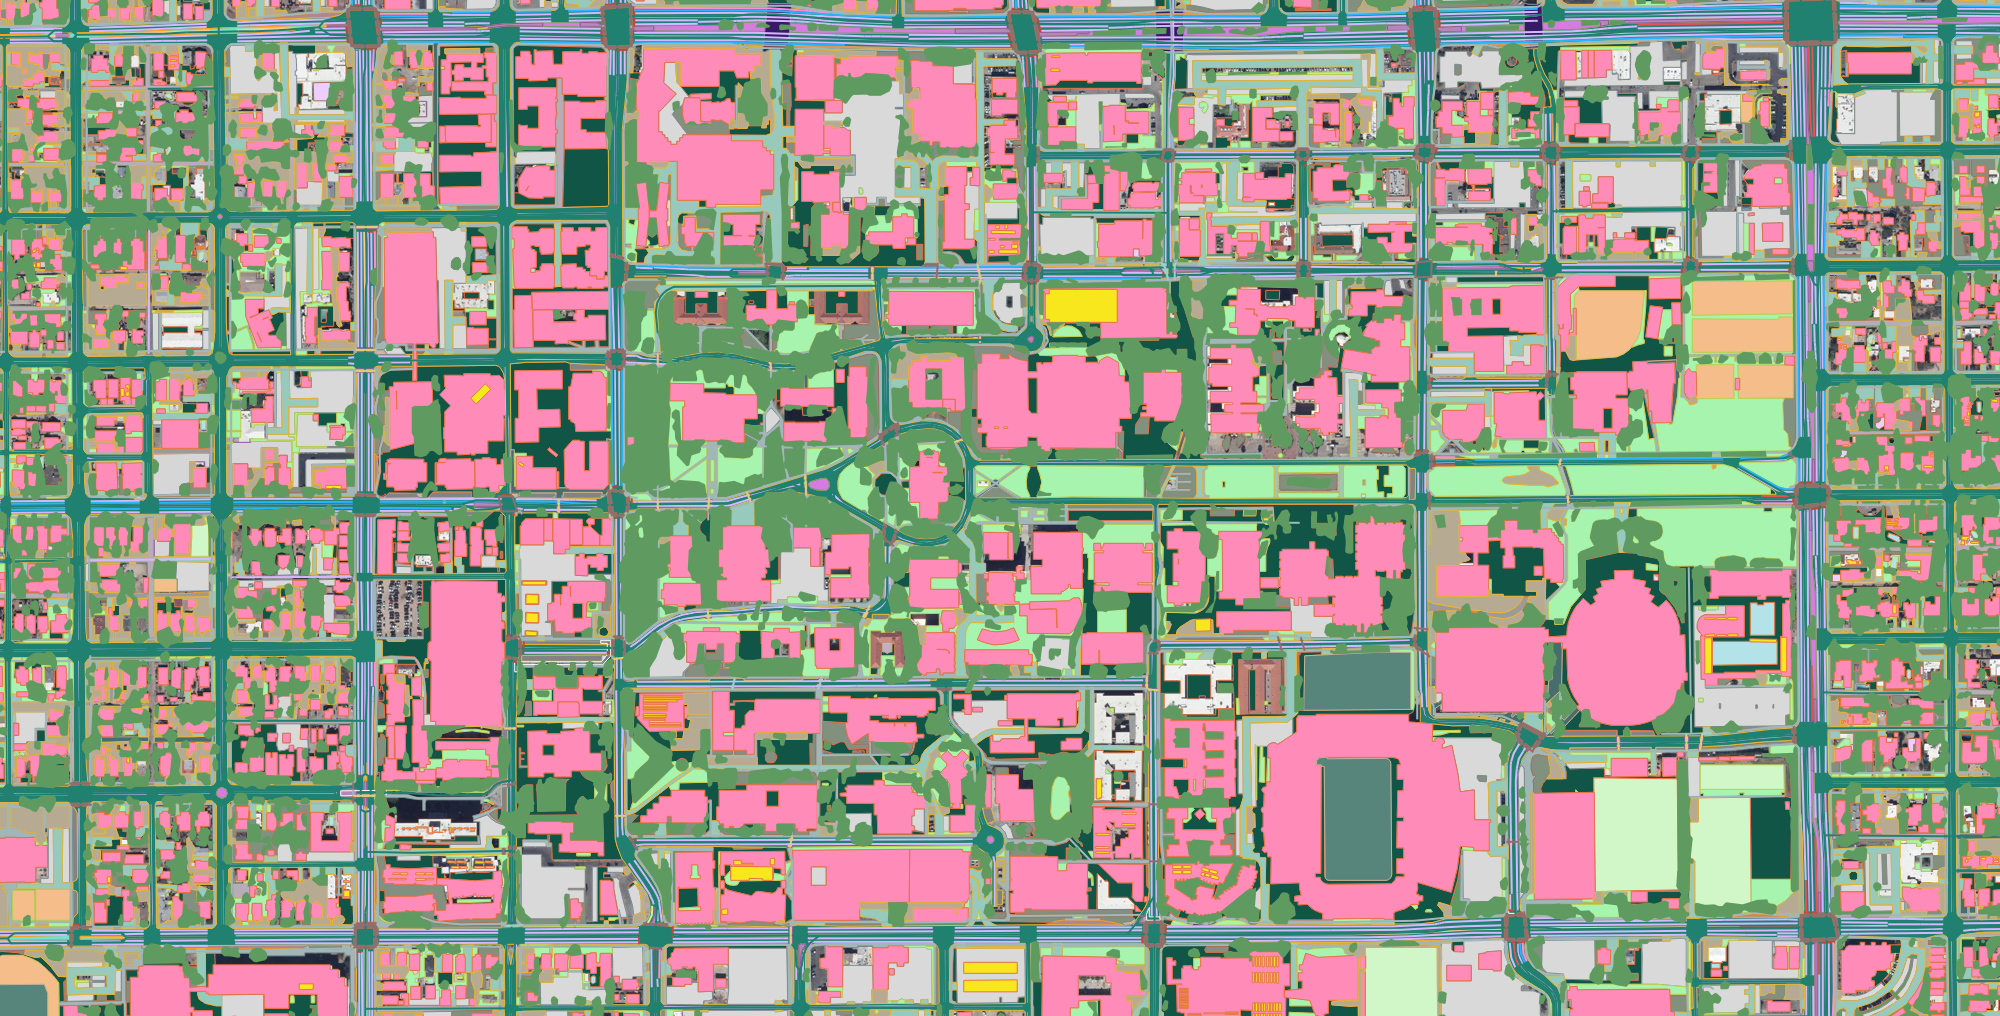
The land cover data pack itself, delivered through the Eagleview and Ecopia partnership, includes 16 feature classes spanning both natural and manmade features, such as grass, bodies of water, roads, and buildings, and supports use cases from urban heat island mapping to fire and flood mitigation.
Example from Ecopia’s client network: The Pima Association of Governments (PAG) in Tucson, Arizona commissioned one of the most comprehensive datasets Ecopia has produced, combining land cover and transportation features into 54 planimetric layers across more than 1,408 square miles. PAG’s engagement built on that core land cover pack with additional transportation layers. PAG’s transportation planners overlaid Ecopia’s tree canopy data with sidewalks and bike lanes to identify shaded, more comfortable routes in Tucson’s heat, while the region’s water department used the same dataset to distinguish irrigated land, like turf and sports fields, from non-irrigated bare land for water budgeting. In more remote parts of the region, Ecopia’s trail data is now helping route 911 calls more precisely. Read more about Ecopia’s work with PAG.
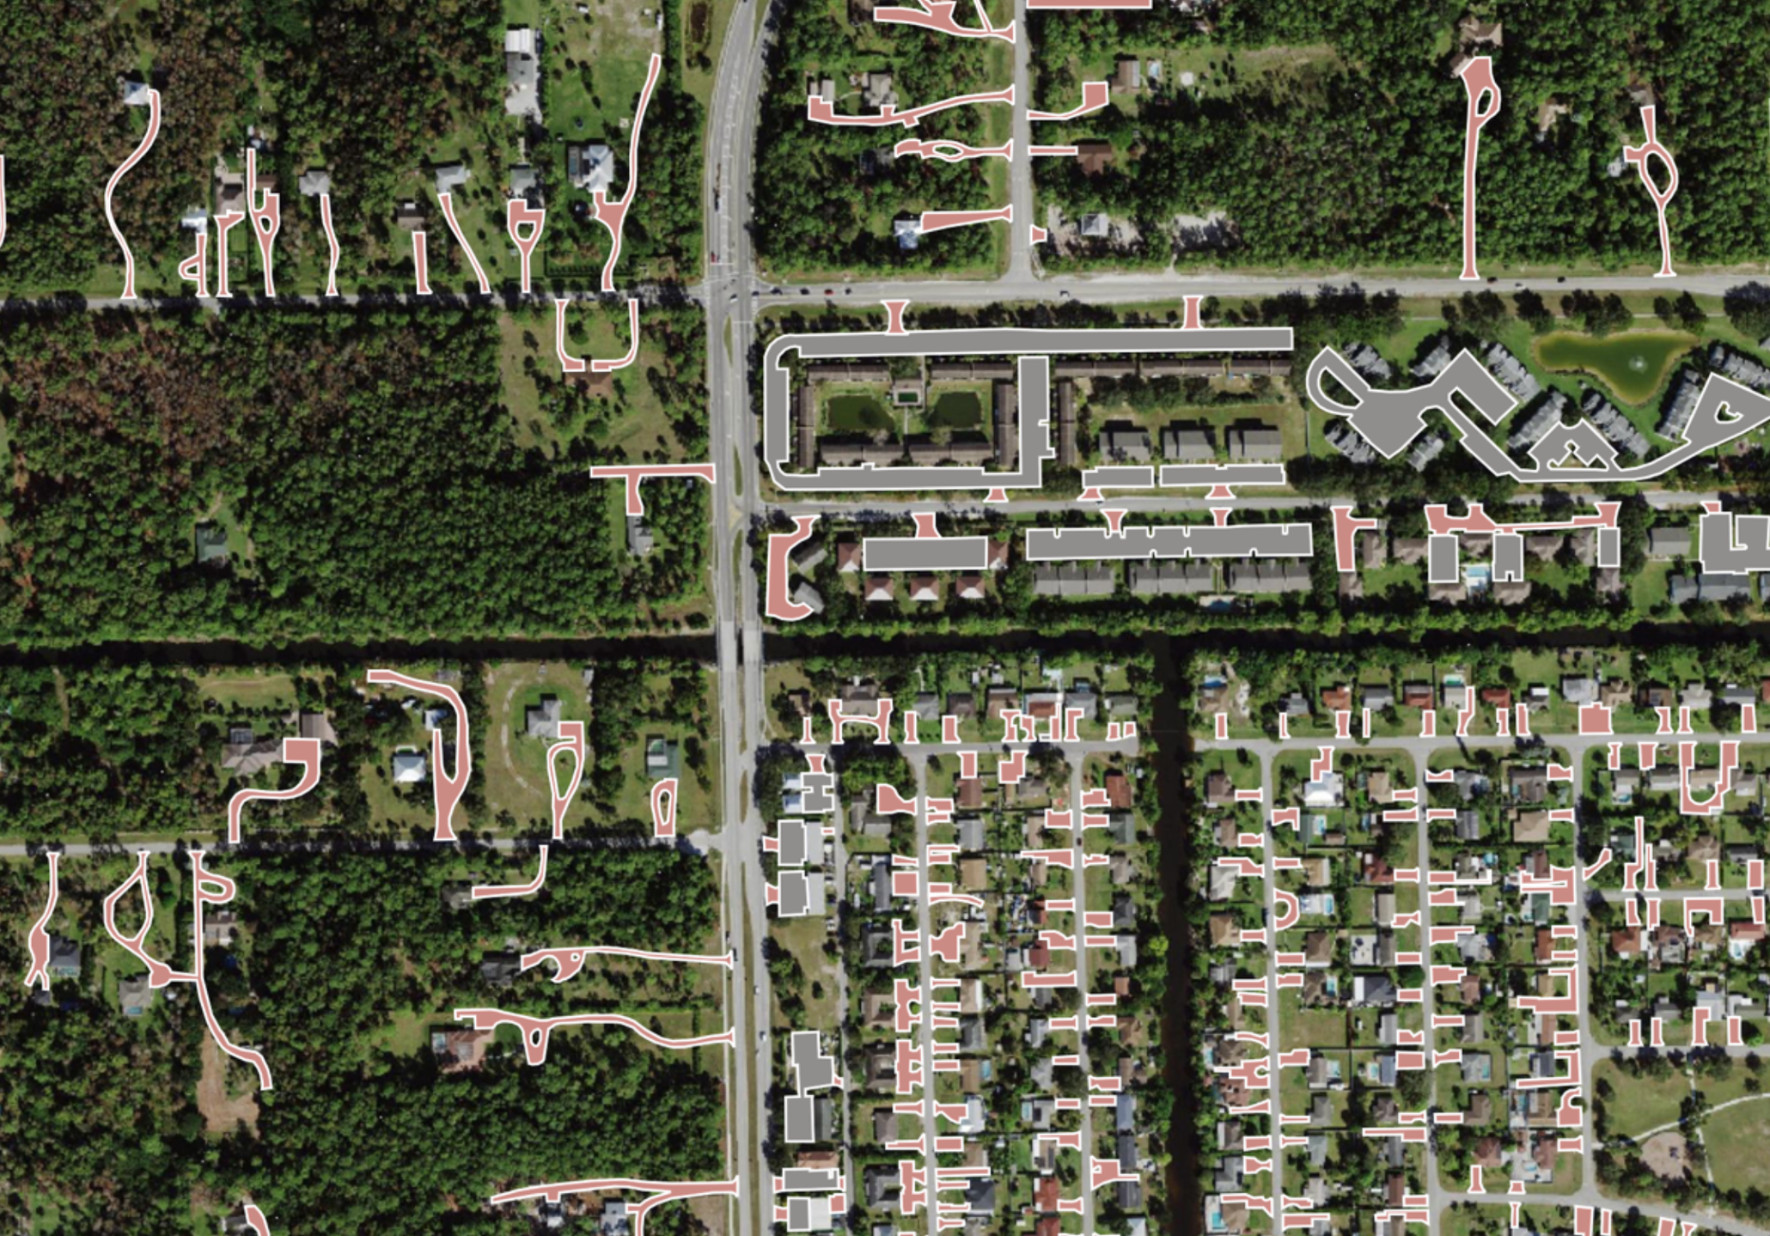
Additional example from Ecopia’s client network: In Collier County, Florida, the GIS team had spent nearly four years, part time, manually digitizing driveways and parking lots to support 911 dispatch routing. Ecopia digitized more than 132,000 of those features in just a few weeks, including 39,000 that were missing entirely from the county’s existing database. Collier County updated its emergency routing system with Ecopia’s data, and the GIS department has since reported significantly fewer complaints about misrouted responders. The county now receives annual updates from Ecopia, including road lane and turn lane detail that further sharpens dispatch decisions. Read the full Collier County emergency response case study.
Vegetation data: scoring wildfire risk down to the property line
The vegetation data pack includes 10 feature classes, from agricultural land and croplands to wild grass and shrubbery, supporting use cases in agriculture, forestry, land management, and utility vegetation management.
Example from Ecopia’s client network: Ecopia works with the California Department of Forestry and Fire Protection (CAL FIRE) across California’s Fire Hazard Severity Zones, covering the state’s State Responsibility Area of more than 31 million acres, roughly a third of California. Ecopia combines vegetation data with building footprints to calculate defensible space around individual properties, including the distance from the nearest tree to a structure, a key factor in fire spread. Differentiating between vegetation types matters here too: a low shrub carries a different risk profile than a tree canopy leaning toward a roofline, and that distinction now feeds directly into California’s statewide fire hazard inventory. Read more about the CAL FIRE and Ecopia partnership.
Building footprints: turning an incomplete map into a billion dollars in broadband funding
Building footprints make up the newest and simplest of the five Eagleview and Ecopia data packs with one feature class, but they remain among the most requested across every industry Ecopia serves. Beyond emergency response and transportation planning, building footprints are essential for broadband network planning, where an accurate count of broadband serviceable locations (BSLs), not just addresses, is often required to apply for federal funding.
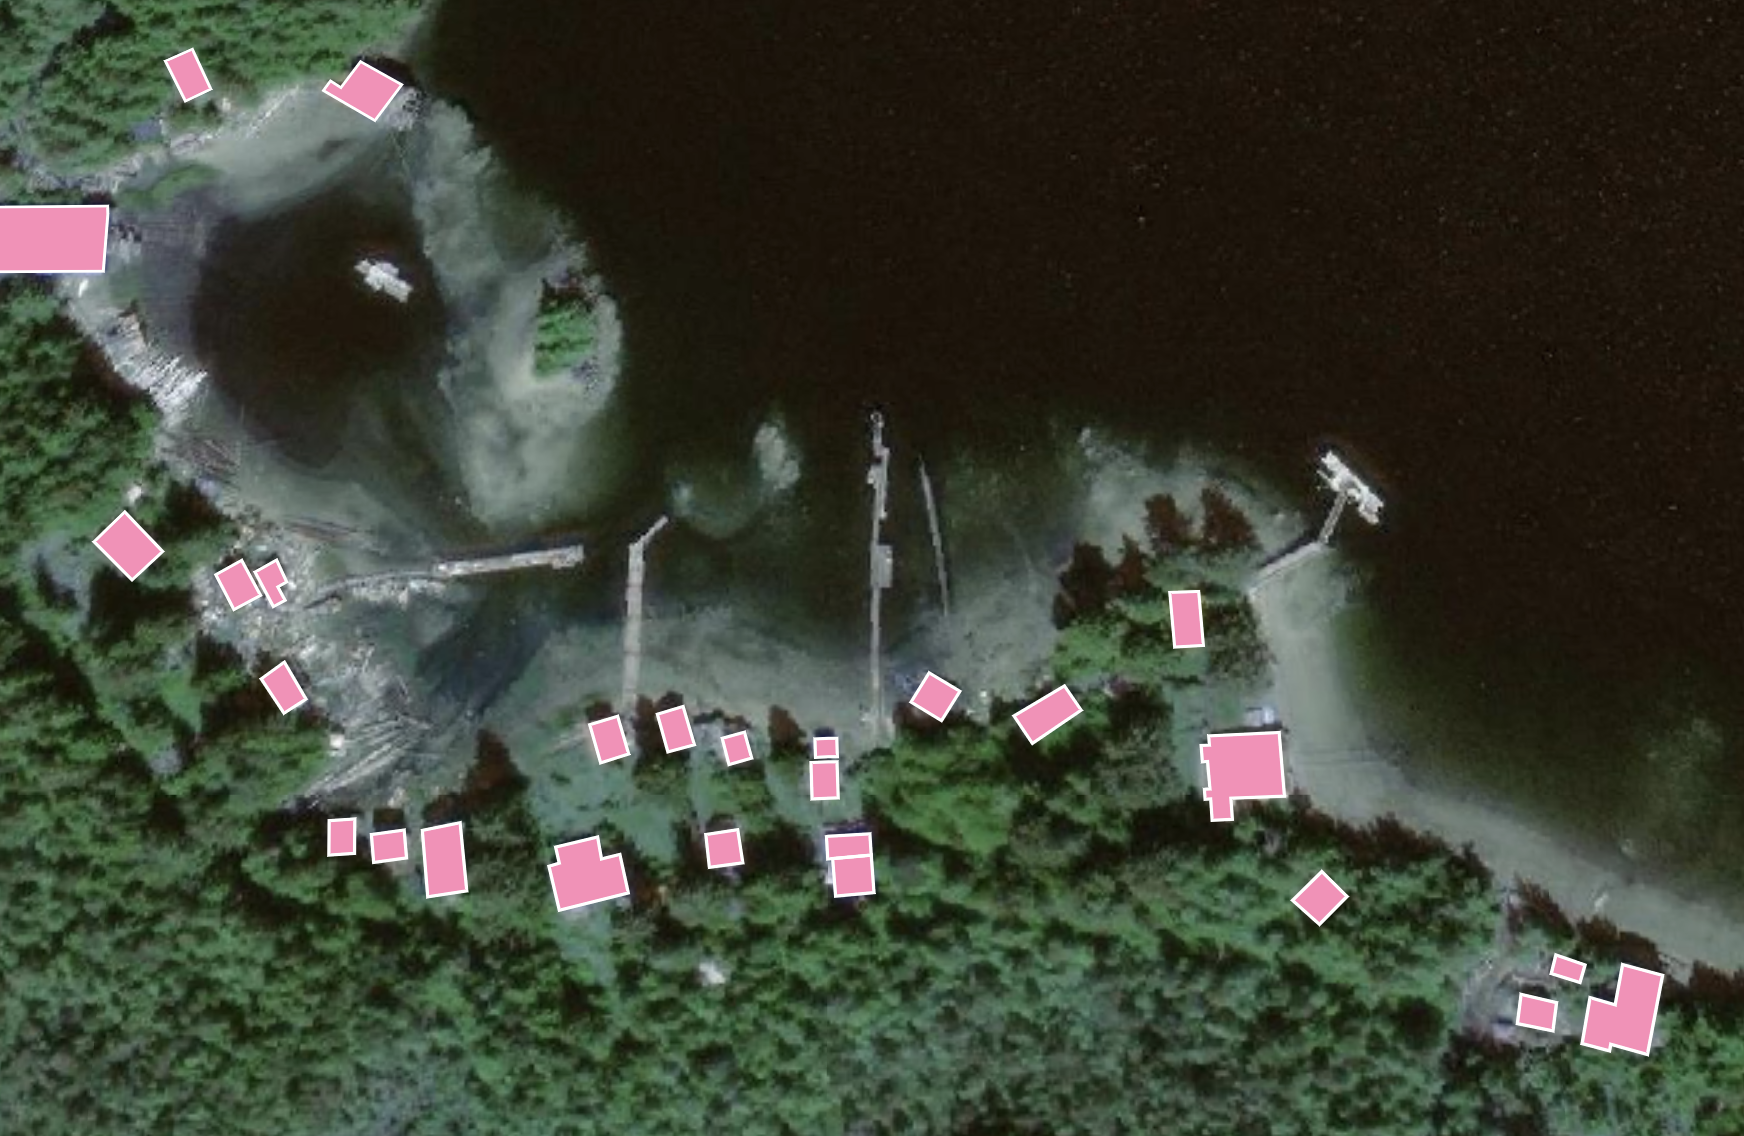
Example from Ecopia’s client network: Before Ecopia mapped it, less than 5 percent of Alaska’s buildings appeared on any map, and those were concentrated almost entirely in metro areas that already had broadband access. Alaska partnered with Ecopia to extract the state’s first ever complete map of buildings, including very remote areas in the state’s unorganized borough. Dewberry consultants then used that data to help the state analyze broadband service levels and build its federal funding application, and Alaska went on to secure more than a billion dollars in Broadband Equity, Access, and Deployment (BEAD) funding to expand broadband access statewide. Read the full broadband funding case study, or explore Ecopia’s Building-Based Geocoding product.
How to access Ecopia’s data packs
The five data packs described above are sold jointly by Eagleview and Ecopia and are available to any Eagleview imagery customer. Ecopia’s process runs best on 1 inch or 3 inch GSD imagery, and Eagleview is flexible on vintage, meaning Ecopia can extract from a historical capture already on file or from imagery flown specifically for a new project. From there, Ecopia delivers data as a standard shapefile for use in ArcGIS Pro or similar GIS and CAD software, or makes it available directly through Eagleview’s Cloud Explorer and Embedded Explorer map viewers.
Organizations interested in any of the five data packs can get in touch with Ecopia’s public sector team to discuss pricing, imagery options, and timelines, or reach out through a regional Eagleview representative.
Watch the full webinar
Fast-Forward Your Path from Imagery to Insight
For a deeper look at Ecopia’s extraction process, the full walkthrough of all five data packs, and the live Q&A with Ecopia, Tim Horak, and Elliott Cox, watch the complete recording above.
Keep reading
Ready to get started?
